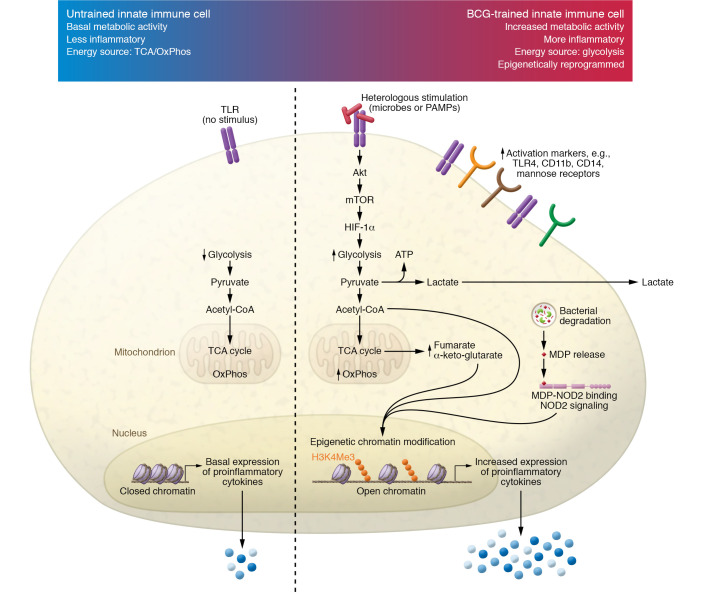
Figure 3. Metabolomic modifications and trained immunity.
Schematic diagram depicting metabolomic changes associated with BCG-mediated trained immunity. Untrained innate immune cells (left) have relatively low levels of glycolysis and oxidative phosphorylation, and they express basal levels of proinflammatory cytokines. Following BCG training (right), metabolic activity in the glycolysis and oxidative phosphorylation pathways is increased, and upon immune restimulation (secondary challenge), immune responsiveness is elevated above levels seen with a primary challenge.

