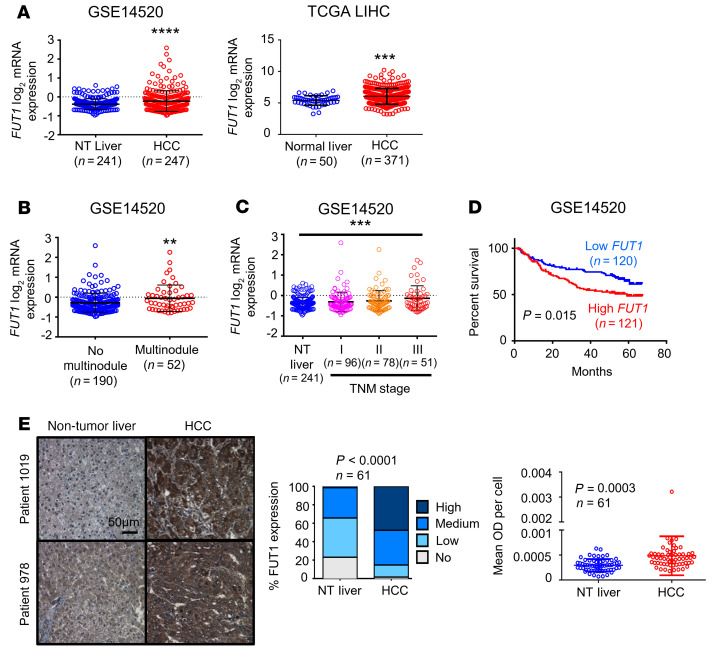
Figure 3. FUT1 overexpression is tightly associated with aggressive clinical features.
(A) Box-and-whisker plot analysis of FUT1 mRNA levels in nontumor (NT) liver or normal liver and HCC tissues using information gathered from the GSE14520 data set from the NCBI Gene Expression Omnibus (GEO) (left) or The Cancer Genome Atlas (TCGA) Liver Hepatocellular Carcinoma (LIHC) database (right) revealed FUT1 to be frequently overexpressed in HCC (unpaired Student’s t test). (B–D) FUT1 overexpression in HCC correlated significantly with multinodular tumors (B), advanced TNM stage (C), and worse overall survival (D) (unpaired Student’s t test, 1-way ANOVA, and Kaplan-Meier survival curve using the log-rank test, respectively). (E) FUT1 immunostaining on a tissue microarray comprising 61 paired NT liver and HCC tissue samples found FUT1 to be frequently overexpressed in HCC. Representative images of immunostaining in 2 patients are shown. Scale bar: 50 μm. The bar graph shows the percentage of cases displaying no, low, medium, and high staining intensity of FUT1 in paired NT and HCC samples (Fisher’s exact test). The dot plot illustrates the quantification of FUT1 by ImageJ (NIH), with both the intensity (mean OD) and number of cells according to the number of nuclei taken into consideration (paired Student’s t test). Mean OD per cell indicates mean OD relative to the number of nuclei. **P < 0.01; ***P < 0.001; ****P < 0.0001.

