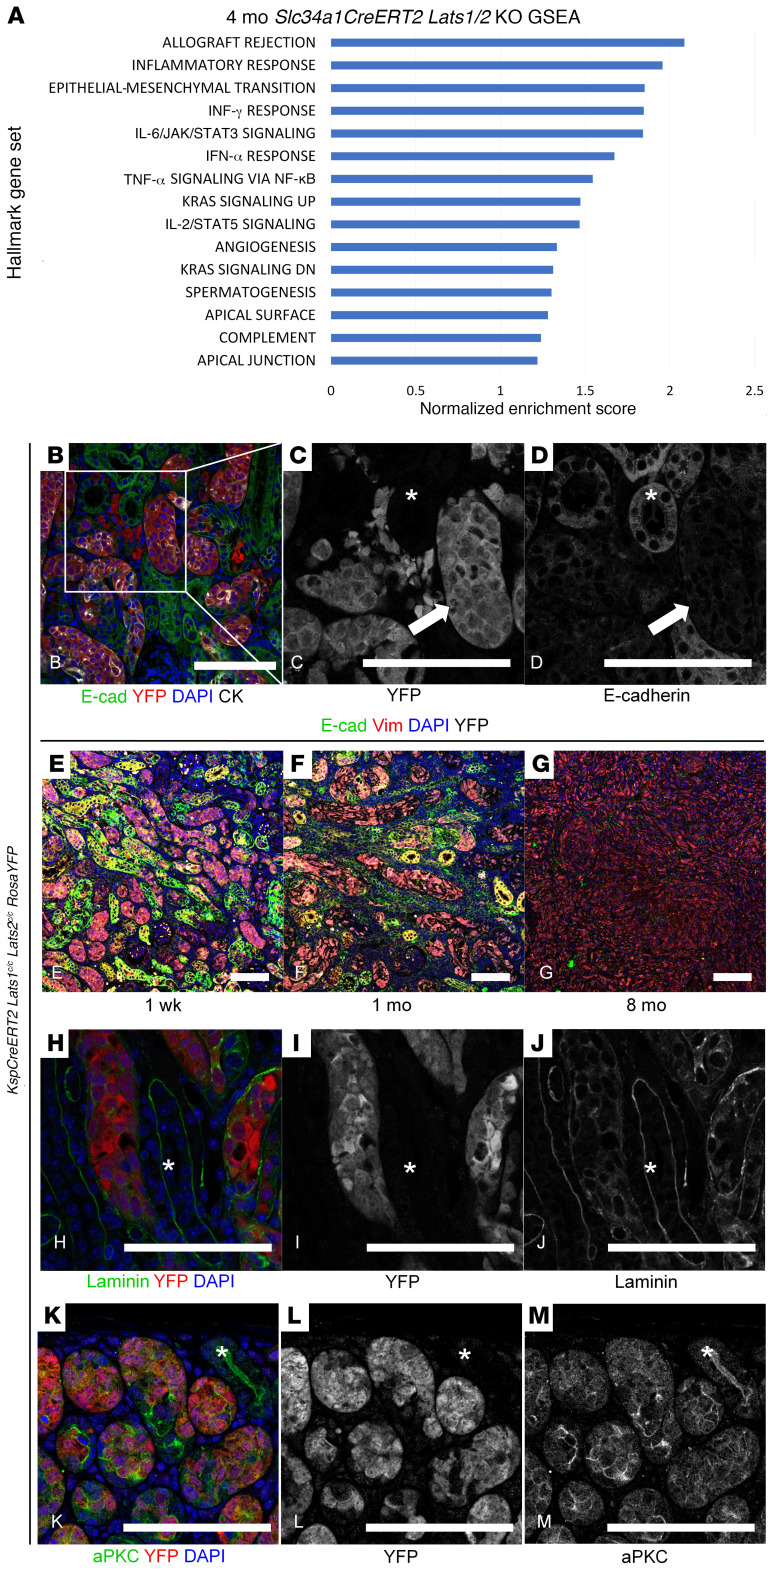
Figure 5. Phenotypic analysis of Lats mutants.
(A) Gene set enrichment analysis (GSEA) on Slc34a1CreERT2 Lats1/2c/c kidneys 4 months after tamoxifen. (B–D) Immunofluorescence staining on section of KspCreERT2 Lats1c/c Lats2c/c RosaYFP kidney 1 week after tamoxifen. (B) Green, E-cadherin; red, YFP; blue, DAPI; white, cytokeratin. Mutant, YFP-positive cells display loss of E-cadherin (C and D, arrows), while WT, YFP-negative tubules express E-cadherin (C and D, asterisks). C and D are single-channel images of YFP and E-cadherin, respectively, corresponding to the box in B. (E–G) Immunofluorescence staining on sections of KspCreERT2 Lats1c/c Lats2c/c RosaYFP kidneys 1 week, 1 month, and 8 months after tamoxifen. Green, E-cadherin; red, vimentin; blue, DAPI; white, YFP. (H–M) Immunofluorescence staining on section of KspCreERT2 Lats1c/c Lats2c/c RosaYFP kidney 1 week after tamoxifen. (H–J) Green, laminin; red, YFP; blue, DAPI. WT, YFP-negative tubules display intact basal lamina (asterisks), while surrounding mutant, YFP-positive cells exhibit disorganized basal lamina. I and J are single-channel images of H showing YFP and laminin, respectively. (K–M) Green, aPKC; red, YFP; blue, DAPI. WT, YFP-negative tubules show apical localization of aPKC (K–M, asterisks), which is not maintained in surrounding mutant, YFP-positive tubules. L and M are single-channel images of G showing YFP and aPKC, respectively. Experiments shown in B–M were conducted on 3 different mutants. Scale bars: (B–M) 100 μm.

