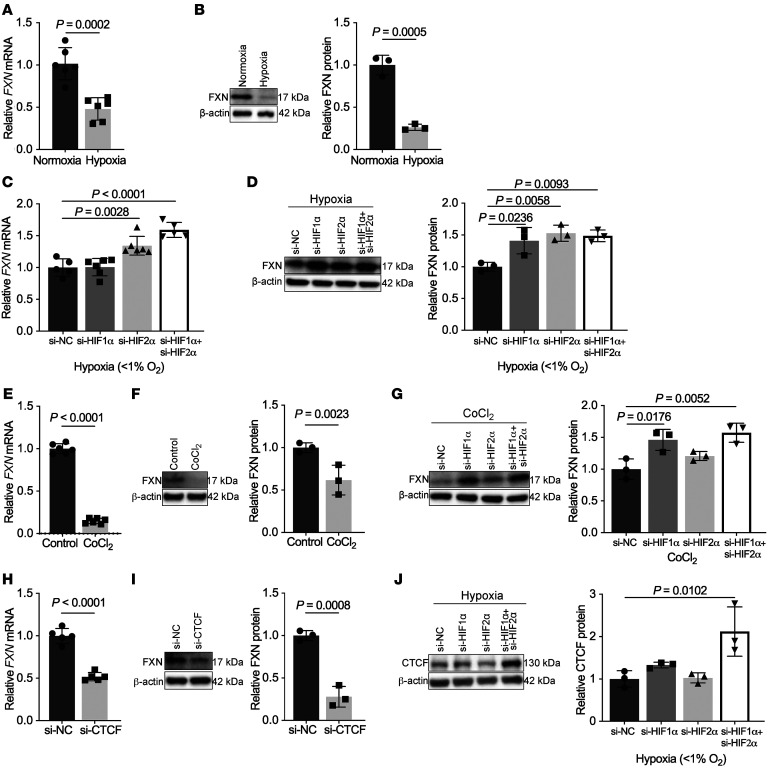
Figure 3. Hypoxia downregulates FXN expression via a HIF-α/CTCF axis in pulmonary artery endothelial cells.
(A and B) RT-qPCR analysis (n = 6/group) and immunoblot with densitometry (n = 3/group) of FXN in cultured human pulmonary artery endothelial cells (PAECs) after exposure to hypoxia (≥ 24 hours, < 1% O2). (C and D) Relative FXN transcript (n = 5–6/group) and protein levels (n = 3/group) in hypoxic PAECs transfected with HIF-1α, HIF-2α, or combined isoform-specific siRNAs compared with negative control (NC). (E and F) FXN expression analysis in PAECs treated with the HIF-1α activator cobalt(II) chloride (≥ 24 hours, 750 μM CoCl2) (n = 6/group and n = 3/group). (G) Immunoblot of FXN in PAECs treated with CoCl2 and transfected with HIF-1α, HIF-2α, or both siRNAs, compared with negative control (n = 3/group). (H and I) RT-qPCR (n = 5/group) and immunoblot (n = 3/group) of FXN in PAECs transfected with siRNA against CTCF or negative control. (J) Immunoblot of CTCF in hypoxic PAECs transfected with HIF-1α, HIF-2α, or both siRNAs, compared with control (n = 3/group). Two-tailed Student’s t test (A, B, E, F, H, and I) and 1-way ANOVA and Tukey’s post hoc analysis (C, D, G, and J) with error bars that reflect mean ± SD.

