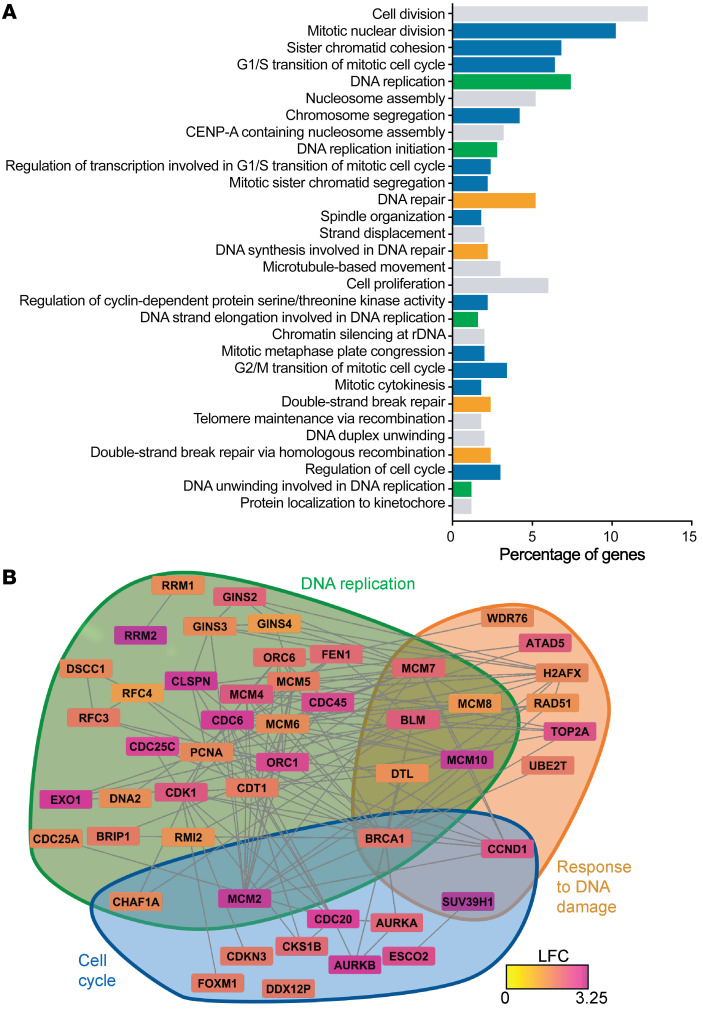
Figure 4. RNA sequencing of FXN-deficient pulmonary artery endothelial cells.
(A) Long RNA sequencing in PAECs transfected with FXN siRNA versus negative control followed by GO enrichment (n = 3/group). Histogram of the top 30 most significant direct GO terms (log fold change [LFC] > 1.2, FDR < 0.05) representing the percentage of differentially expressed genes in the RNAseq data set within each pathway. GO terms specifically related to cell cycle (blue), DNA replication (green), and cellular response to DNA damage stimulus (orange) and others (gray). (B) Hypergraph of differentially expressed genes (FDR < 0.05), depicting log fold change via a color scale within GO pathways pertaining to cell cycle (blue), DNA replication (green), and cellular response to DNA damage stimulus (orange).

