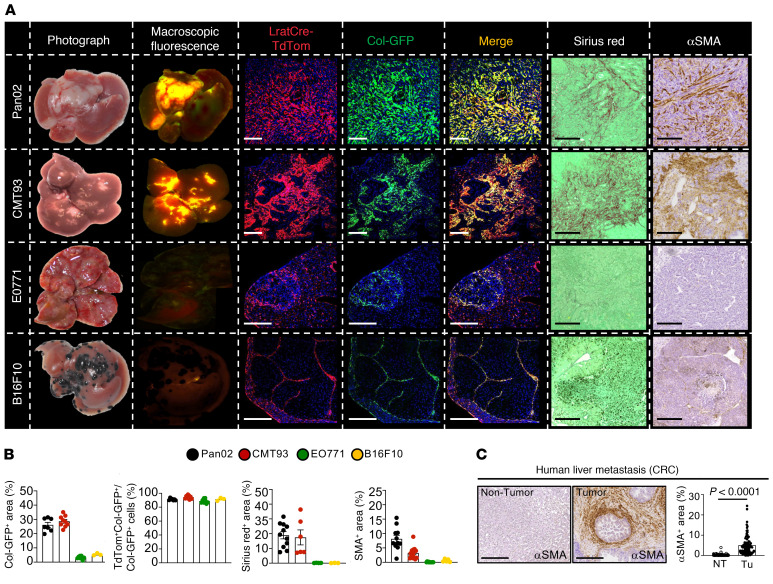
Figure 1. CAF ontogeny in mouse and human liver metastasis.
(A) Tumor images and their macroscopic fluorescence of LratCre-TdTom and collagen1a1-GFP; confocal microscopy of LratCre-TdTom, collagen1a1-GFP (Col-GFP), Sirius red, and αSMA IHC in Pan02, CMT93, EO771, and B16F10 liver metastasis. Scale bars: 100 μm. (B) Quantification of data in A. Data are shown as the mean ± SEM; n = 3–9 mice/cell line. (C) Representative IHC and quantifications of αSMA in human CRC liver metastasis (n = 100). NT, nontumor; Tu, tumor. Scale bars: 100 μm. Data are shown as the mean ± SEM; paired t test.

