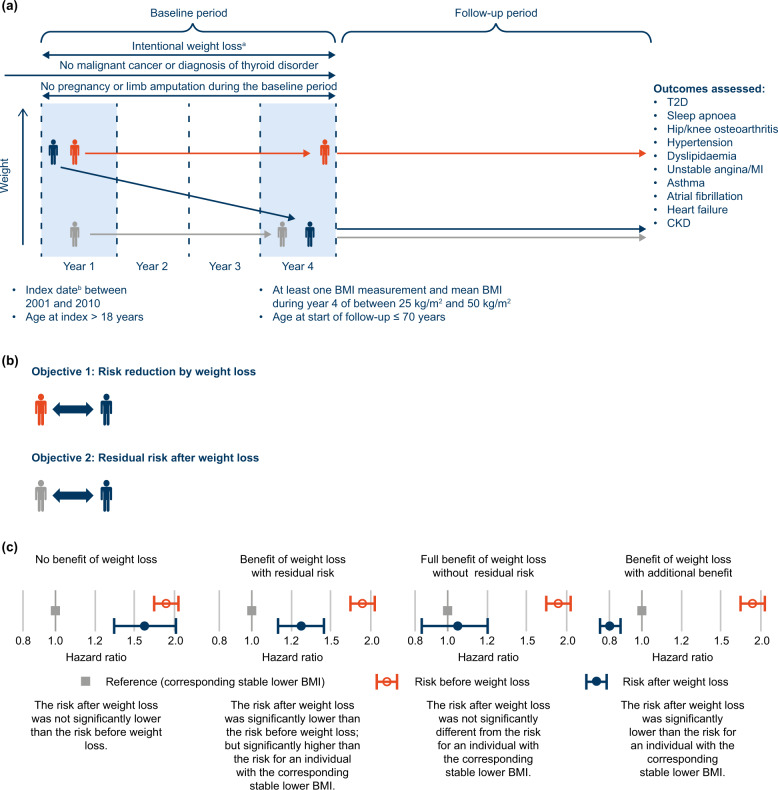
Fig. 1. Study design and objectives.
a Study design showing weight trajectories for the stable-weight (−5% to +5% BMI; orange), weight-loss cohorts (−25% to −10% BMI; blue) and corresponding stable lower BMI (grey). b Illustration of the comparisons made as part of objective 1 and objective 2 at the end of the follow-up period. c Example hazard ratio profiles (HRs and 95% CI) showing the comparative benefit patterns before weight loss (orange) with the risk after weight loss (blue) relative to the corresponding stable lower BMI (grey). aRecord indicating either a weight-loss diet, weight-loss drug prescription, or referral to a dietician or for bariatric surgery during the baseline period, to confirm the intention to lose weight; bDate of first BMI calculation. BMI body mass index, CI confidence interval, CKD chronic kidney disease, HR hazard ratio, MI myocardial infarction, T2D type 2 diabetes.

