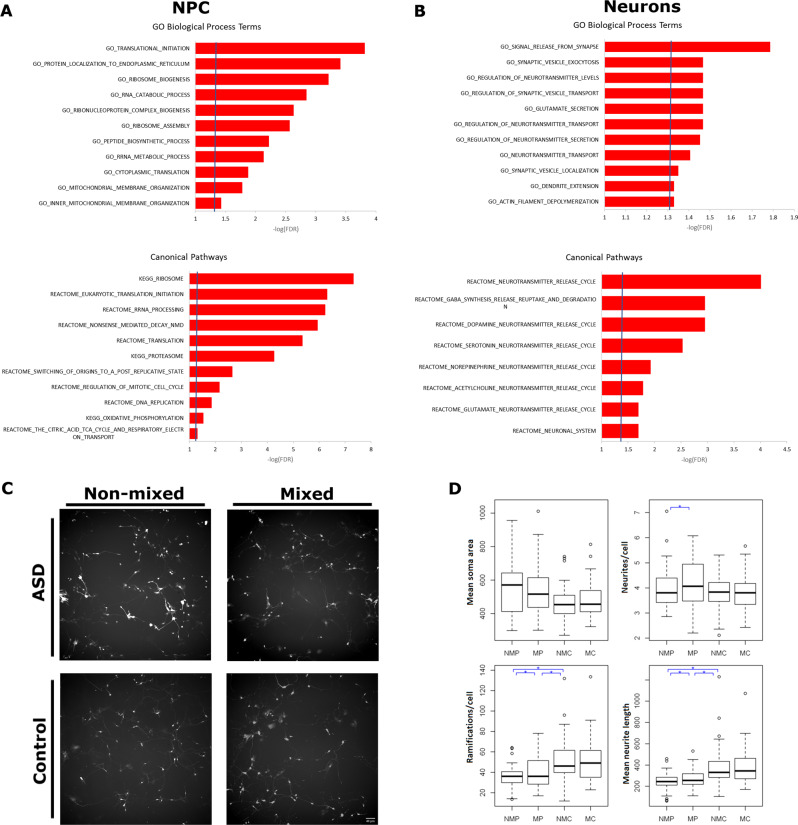
Fig. 2. Functional annotation analysis of differentially expressed genes in NPC and neurons from ASD individuals.
a Functional annotation analysis shows that top upregulated genes in ASD NPC are enriched (red) within Gene Ontology (GO) terms and canonical pathways related to ribosome biogenesis, translation regulation and mitochondrion function. b Top ranked upregulated genes in ASD neurons (red) are enriched within GO terms and pathways related to synaptic signaling, neurotransmitter release and dendrite extension. A full description of the functional annotation analysis is available in Supplementary Tables 6 and 7. c Illustrative images of ASD neurons co-cultured with non-GFP neurons from the same individual or non-GFP neurons from a control, and control neurons co-culture with non-GFP neurons from the same individual or from an ASD individual. d Box plots showing the quantification of soma size, neurites per cell, number of ramifications per cell and neurite length for all these conditions. NMP: non-mixed patient (n = 3 clones); MP: mixed patient (n = 3 clones); NMC: non-mixed control (n = 5 clones); MC: mixed control (n = 5 clones). At least eight photos per individual per condition were analyzed.

