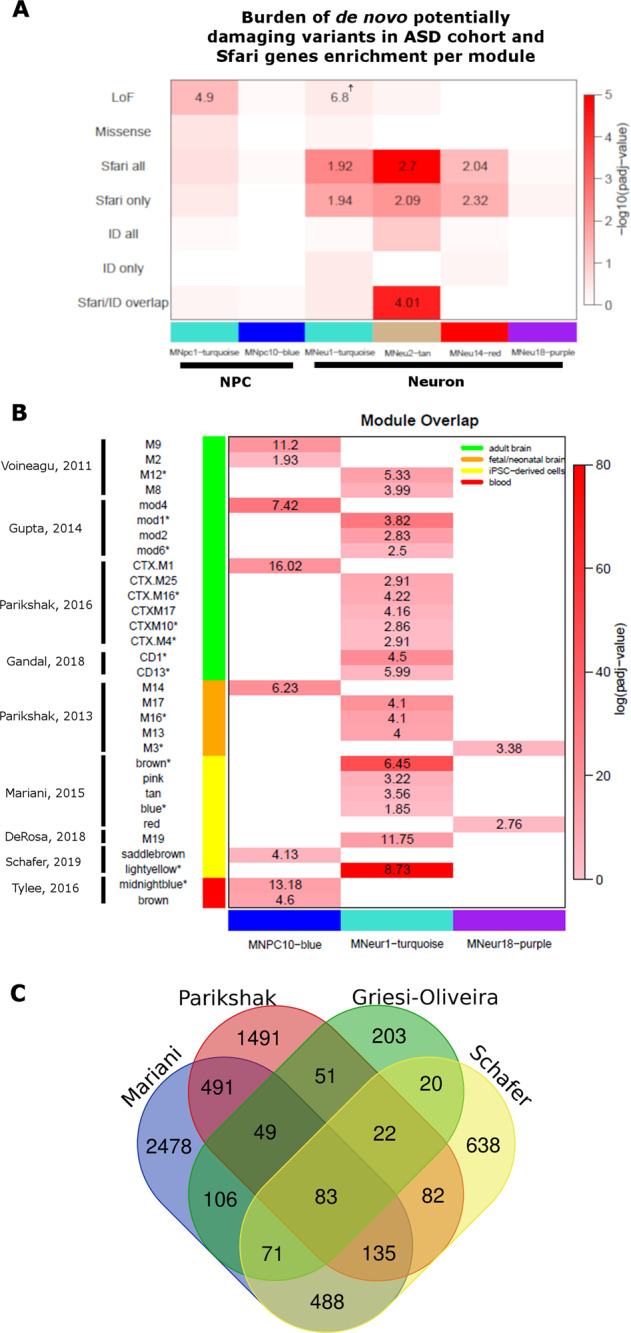
Fig. 5. Consistent association of MNeu1-turquoise with ASD.

a Genetic evidence for MNeu1-turquoise involvement in ASD pathophysiology: the top part of the panel shows the burden of de novo potentially damaging LoF and missense variants in ASD cohort for the indicated modules, while the bottom part shows enrichment for Sfari and/or ID related genes. Heatmap colors refers to FDR values of enrichment trend. Odds-ratio values are only plotted for those modules that showed enrichment for genes in the denoted category (FDR < 0.05; OR > 1), except for the burden of ASD patients harboring LoF variants in MNeu1-turquoise (☨) which, although not statistically significant, presented a clear trend of enrichment. FDR and OR values for the full set of modules are available in Supplementary Table S12. b Module overlap analysis comparing the three ASD-associated modules identified in this study with a series of transcriptome studies conducted either with postmortem brain samples or iPSC-derived neuronal cells (as indicated by the legend at left). All the modules that presented significant overlap with MNPC10-blue, MNeu1-turquoise, or MNeu18-purple (FDR < 0.05, OR > 1) are shown and modules associated with ASD in each of the selected studies are indicated by an asterisk. Modules correspondent to MNPC10-blue were identified in all the selected studies and, although not associated with ASD in none of the studies conducted with neuronal samples, it was detected as dysregulated in ASD patients in a metanalysis investigation of blood transcriptome. A MNeu18-purple correspondent module was identified in fetal brain samples and such module was found as enriched for LoF damaging variants present in ASD patients. MNeu1-turquoise correspondent modules were identified in all the studies and, in all of them, they were found as dysregulated in ASD patients. Heatmap colors refers to FDR values of enrichment trend and odds-ratio values are plotted (FDR < 0.05; OR > 1). For detailed overlap analysis, refers to Supplementary Table S13. c Venn-diagram showing the number of genes in overlap between the different MNeu1-turquoise correspondent modules identified in studies conducted with either fetal neuronal brain or iPSC-derived neurons.
