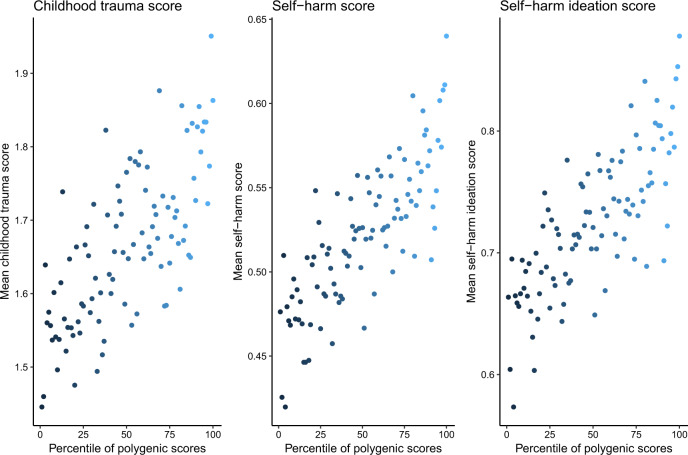
Fig. 2.
Scores on childhood trauma and SSBI based on centiles of PGS. a. This figure provides the scores of three primary phenotypes against the percentile of PGS after the cohort was divided into 100 groups based on PGS. Each dot in the plot represents an average phenotypic score for that group. Colours indicate the gradient of percentile, with lighter blue representing the highest percentile and darker blue representing the lowest percentile

