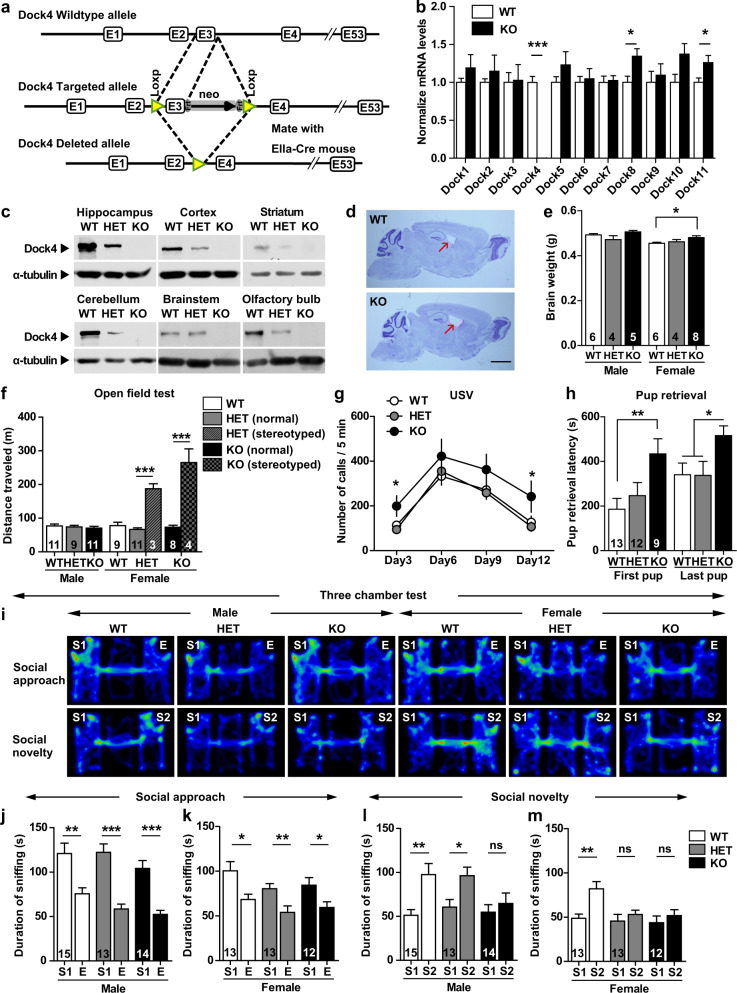
Fig. 1.
Dock4 KO mice exhibit altered social behavior. a Strategy used for generating Dock4 KO mice. b Brain mRNA levels of Dock4 and other Dock-family members were assessed using quantitative RT-PCR; mRNA levels of KO mice were normalized to those of WT mice. n = 6 WT or KO mice; *P < 0.05, ***P < 0.001, unpaired t test. c Dock4 protein expression in different brain regions of WT, HET, and KO mice; α-tubulin was used as a loading control. d Nissl staining of sagittal brain sections from 5-month-old WT and KO mice. Brain lateral ventricles were slightly enlarged in KO mice (arrows). Scale bar, 2 mm. e Brain weight measurements from 5-month-old WT, HET, and KO mice. *P < 0.05, one-way ANOVA with Bonferroni’s Multiple Comparison Test. f Distance traveled by WT, HET, and KO mice in open-field test. Hyperactivity was displayed by a small population of HET (~1.7%; 3/172) and KO (~9.1%; 4/44) female mice that exhibited stereotyped circling behavior. ***P < 0.001, unpaired t test. g Ultrasonic vocalizations of pups at P3, P6, P9, and P12 during maternal separation for 5 min. n = 28, 28, 29, and 26, respectively for WT; n = 39, 41, 38, and 38, respectively for HET; n = 13, 15, 15, and 13, respectively for KO. *P < 0.05, one-way ANOVA with Bonferroni’s Multiple Comparison Test. h Pup-retrieval assay was performed to evaluate maternal behavior of virgin female mice. Latency of retrieving the first pup and all 3 pups was measured in a 10-min trial. *P < 0.05, **P < 0.01, one-way ANOVA with Bonferroni’s Multiple Comparison Test. i Representative heatmap of movement of male and female WT, HET, and KO mice during social approach and social novelty phases of the Three-chamber test. j, k Duration spent in sniffing different cups, measured for male (j) and female (k) WT, HET, and KO mice during social approach. l, m Duration spent in sniffing different cups, measured for male (l) and female (m) WT, HET, and KO mice during social novelty preference. E, empty cup; S1, cup containing stranger mouse #1; S2, cup containing stranger mouse #2. *P < 0.05, **P < 0.01, ***P < 0.001, ns, no significant, unpaired t test. n values of each group are displayed on the corresponding bars of the bar charts. Error bars: SEM

