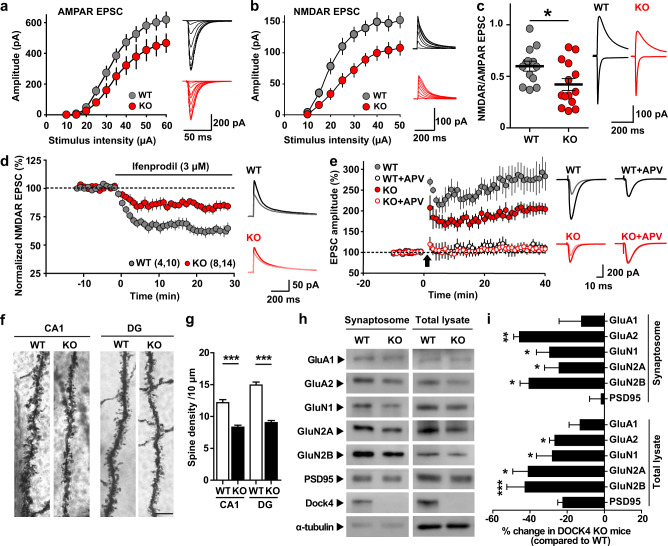
Fig. 4.
AMPAR and NMDAR-dependent synaptic transmission is impaired in Dock4 KO hippocampus. a, b KO neurons displayed a downward input-output curve of both AMPAR-EPSC (a) (25–30% decrease at strongest stimulation relative to WT; n = 10 cells from 3 WT mice; n = 12 cells from 4 KO mice, P < 0.001, two-way AVOVA) and NMDAR-EPSC (b) (30–35% decrease at strongest stimulation relative to WT; n = 26 cells from 6 WT mice; n = 24 cells from 5 KO mice, P < 0.001, two-way AVOVA). Representative traces are shown in the right panel of each graph. c NMDAR-EPSC to AMPAR-EPSC ratios from WT (13 cells, 5 mice) and KO (15 cells, 5 mice) groups. Representative traces are shown on the right. *P < 0.05, unpaired t test. d KO mice showed a reduction in the proportion of synaptic GluN2B. Values are presented as change of NMDAR-EPSC (% of baseline) after application of ifenprodil, an GluN2B inhibitor. Representative traces before and at 20–30 min after application of ifenprodil are shown on the right. n = 10 cells from 4 WT mice; n = 14 cells from 8 KO mice. P < 0.05, unpaired t test. e Time-course changes of EPSC amplitude (% of baseline) after a pairing protocol (0 mV, 2 Hz, 360 pulses; arrow), with or without application of APV, measured from WT (Ctr, 12 cells, 5 mice; APV: 9 cells, 4 mice) and KO (Ctr: 14 cells, 6 mice, APV: 13 cells, 6 mice) groups. P = 0.0241, WT vs. KO; P = 0.00001, WT + APV vs. WT; P = 0.0001, KO + APV vs. KO, unpaired t test. Representative traces before and at 25–35 min after pairing are shown on the right. f Representative Golgi staining images of dendritic spines of hippocampal CA1 and dentate gyrus (DG) neurons in WT and KO mice. Scale bar, 5 μm. g Spine density was decreased in both the hippocampal CA1 and DG regions of KO mice. n = 3 WT and KO pairs. ***P < 0.001, unpaired t test. h Expression levels of AMPAR and NMDAR subunits in the synaptosomal fraction and total lysate of the hippocampus of WT and KO mice. GluA2, GluN1, GluN2A, and GluN2B subunits were decreased at the synapse as well as in the whole hippocampus. α-tubulin served as a loading control. i Alteration of synaptosomal and total expression of indicated proteins in the KO hippocampus, expressed as fold-change of that in WT. n = 4 WT and KO pairs, *P < 0.05, **P < 0.01, ***P < 0.001, unpaired t test. Error bars: SEM

