Fig. 6.
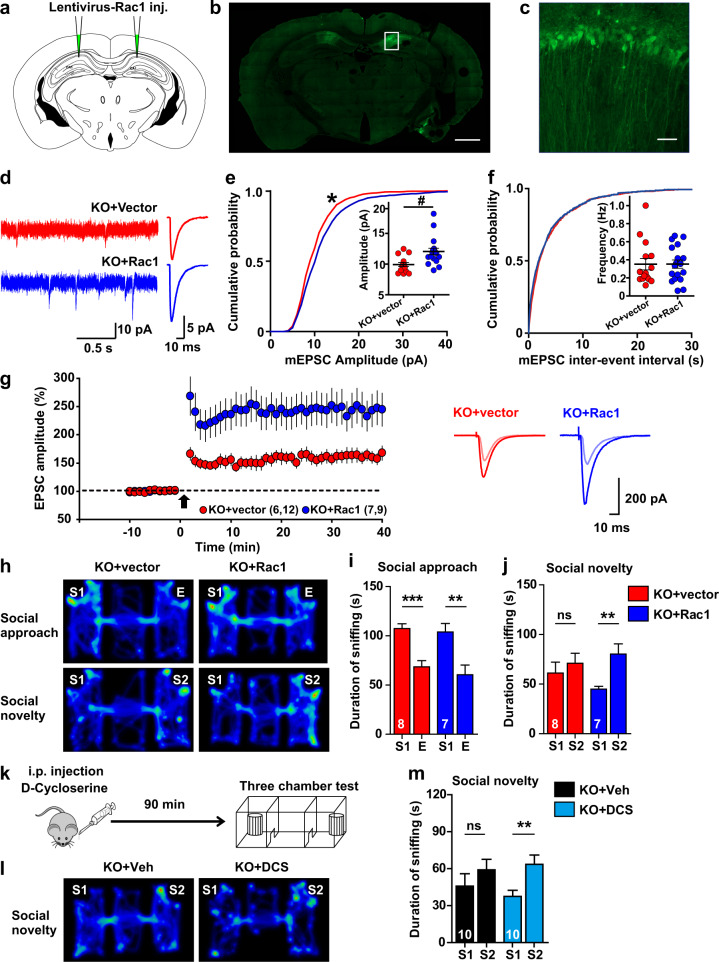
Impaired social behavior of Dock4 KO mice is rescued by enhancing Rac1 activity or NMDAR function. a Rac1-lentivirus was bilaterally injected into the hippocampal CA1 region of Dock4 KO mice. b GFP signals observed in CA1 pyramidal neurons at 4 weeks post-injection confirmed successful Rac1 or control vector expression. Scale bar, 1000 μm. c Higher-magnification view of boxed CA1 area in b. Scale bar, 40 μm. d Representative (left) and average (right) traces of mEPSCs recorded from KO pyramidal cells expressing either vector (KO + vector) or Rac1 (KO + Rac1). e, f Cumulative probability of mEPSC amplitude (e) and inter-event interval (f). Insets: average mEPSC amplitude (e) and frequency (f). n = 15 cells from 4 KO + vector mice; n = 18 cells from 4 KO + Rac1 mice. *P < 0.05, two-sample Kolmogorov–Smirnov test. #P < 0.05, unpaired t test. f mEPSC frequency from KO + vector or KO + Rac1 cells. g Time-course changes of EPSC amplitude (% of baseline) after a pairing protocol (0 mV, 2 Hz, 360 pulses; arrow), measured from KO + vector (12 cells, 6 mice) or KO + Rac1 (9 cells, 7 mice) groups. P = 0.021, unpaired t test. Representative traces before and at 25–35 min after pairing are shown on the right. h Representative heatmap of movement of KO + vector or KO + Rac1 mice in the Three-chamber test at 4 weeks after virus injection. i, j Duration spent by KO + vector or KO + Rac1 mice in sniffing different cups during social approach (i) and social novelty (j) phases. E, empty cup; S1, cup containing stranger mouse #1; S2, cup containing stranger mouse #2. n = 8 KO + vector mice (4 males and 4 females), and n = 7 KO + Rac1 mice (4 males and 3 females). **P < 0.01, ***P < 0.001, ns, no significant, unpaired t test. k Outline of experimental design for D-cycloserine (DCS) treatment. l Representative heatmap of movement of KO mice in social novelty phase at 90 min after administration of DCS (20 mg/kg; KO + DCS) or vehicle (KO + Veh). m Duration spent by KO + Veh or KO + DCS mice in sniffing different cups during social novelty phase. n = 10 KO + Veh mice (5 males and 5 females), and n = 10 KO + DCS mice (5 males and 5 females). *P < 0.05, unpaired t test. n values of each group are displayed on the corresponding bars of the bar charts. Error bars: SEM

