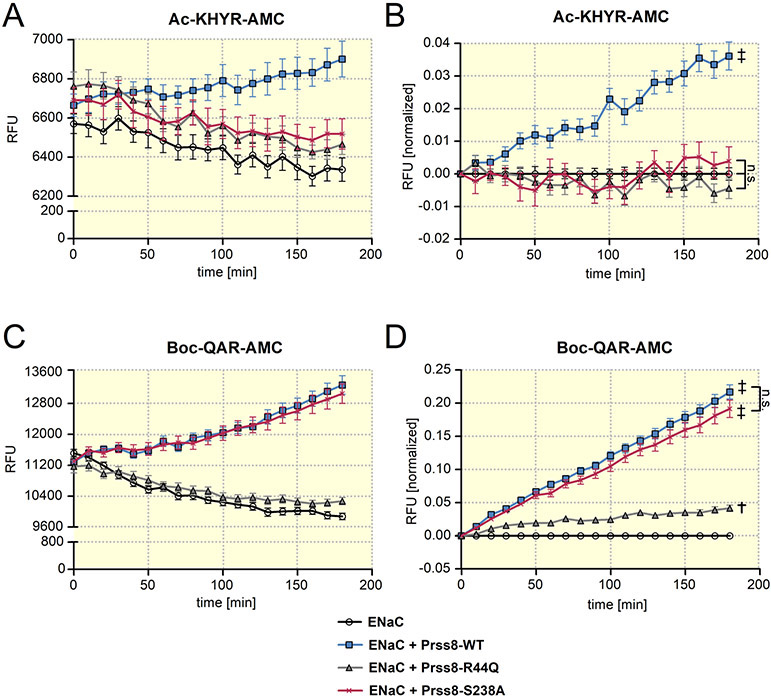
Figure 2: Analysis of protease activity at the cell surface of oocytes expressing wild-type Prss8, zymogen-locked Prss8-R44Q or catalytically inactive Prss8-S238A.
Proteolytic activity of prostasin (A, B) or of trypsin-like proteases (C, D) at the cell surface of oocytes detected using Ac-KHYR-AMC or Boc-QAR-AMC fluorogenic substrate, respectively. Progress curves of proteolytic activity (mean ± SEM) are shown for oocytes expressing ENaC alone or co-expressing ENaC with Prss8-wt, Prss8-R44Q or Prss8-S238A. In A and C, representative recordings of absolute fluorescent signal values (RFU=relative fluorescent unit) obtained in oocytes from one batch are shown (A: n=8; C: n=10). In B and D, RFU values obtained in different batches of oocytes (B: n=40, N=5; D: n=78, N=9) were normalized to account for the batch to batch variability of the absolute RFU values and to correct for the signal decline due to photobleaching. In each individual recording RFU values were normalized to the initial RFU value at the beginning of the measurement. In addition, for each time point the average normalized RFU values measured in oocytes expressing ENaC alone were subtracted from the corresponding individual normalized RFU values. ‡, p<0.001; †, p<0.01; n.s., not significant; one-way ANOVA with Bonferroni post hoc test (at the time point 180 min).

