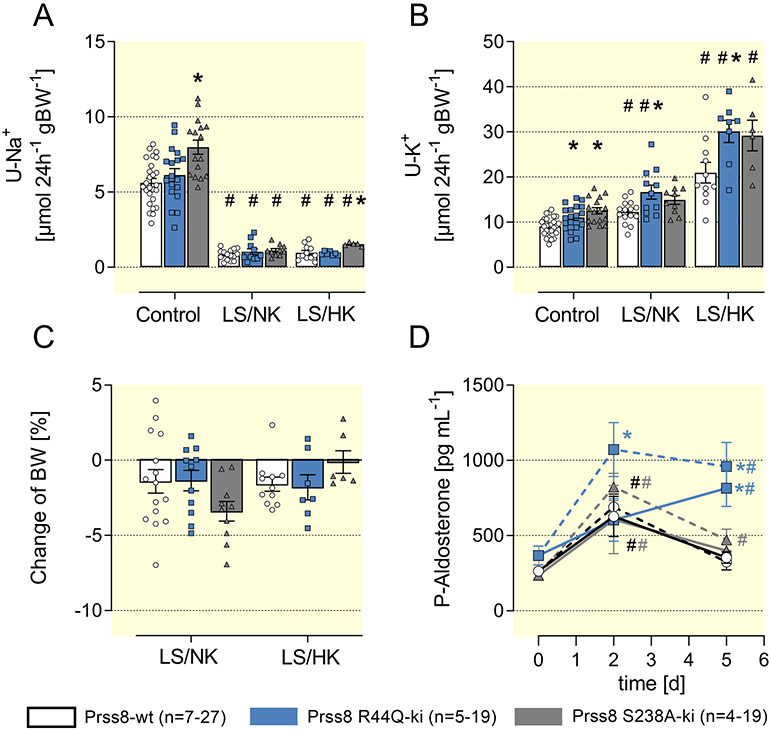
Figure 4: Sodium conservation is not impaired in Prss8-wt, Prss8-S238A and Prss8-R44Q mutant mice.
(A, B) 24 h urinary sodium and potassium excretion under a control, low sodium (LS/NK) or low sodium + high potassium diet (LS/HK) on the 5th day.
(C) Change in body weight calculated as the difference between baseline and value on the 5th day.
(D) Time course of plasma aldosterone concentration after switch to a low sodium diet with normal potassium content (LS/NK, solid lines) or a low sodium with a high potassium content (LS/HK, dashed lines).
# indicates significant difference between low sodium and control diet, * indicates significant difference between the genotypes

