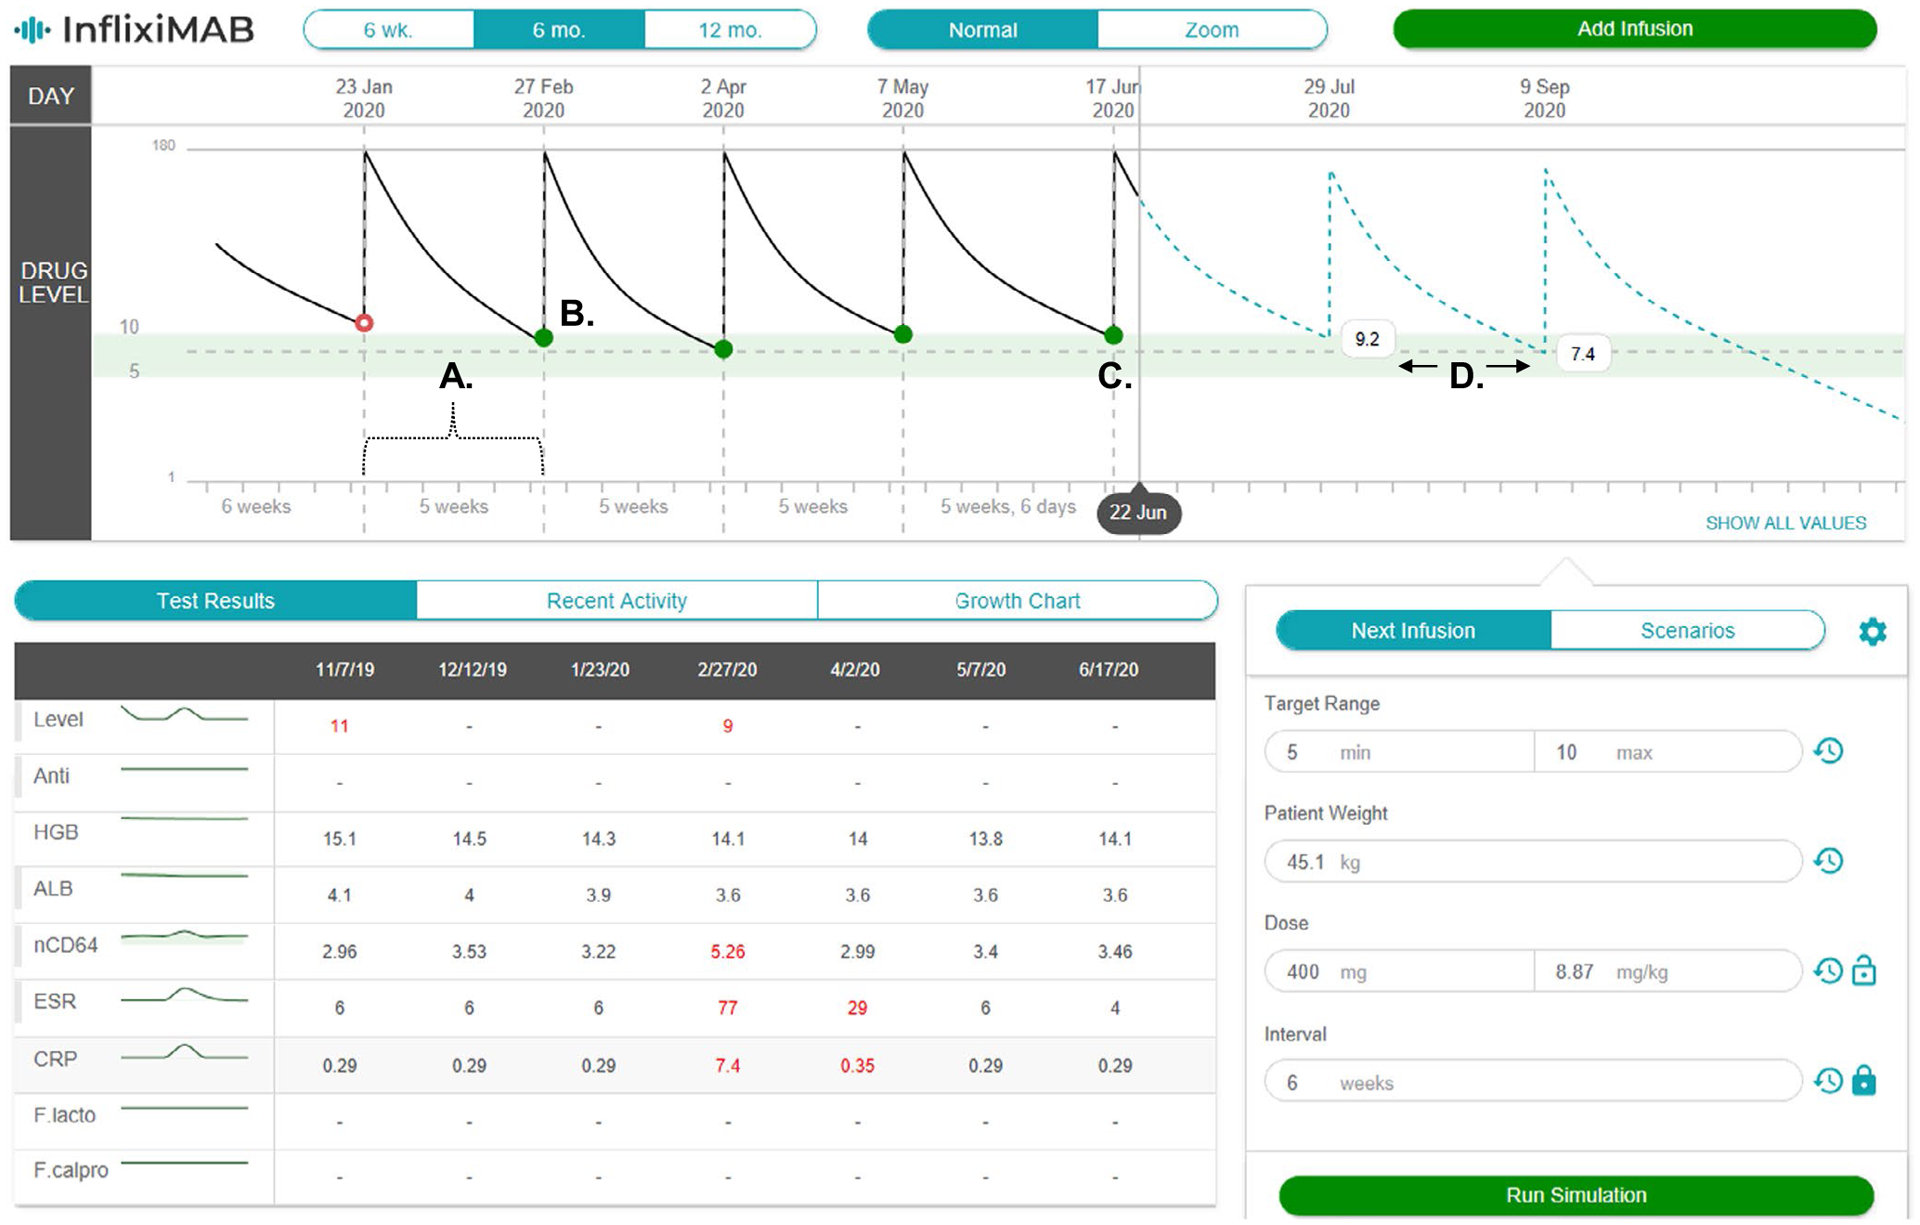
Figure 5.

The infliximab pharmacokinetic (PK) dashboard is shown as a screen shot from the electronic health record. The patient’s previous infusion (a) intervals (weeks and days), (b) measured (actual) trough concentrations, (c) the model-predicted trough concentration from the last infusion, and (d) model-predicted trough concentrations and PK curves (blue dashed-line) for the next two infusions are shown. The dashboard is equipped with an adjustable target range (green-shaded) for trough concentrations and a display of previous laboratory results in the lower left panel. ALB, albumin; ESR, and erythrocyte sedimentation rate; nCD64, neutrophil CD64.
