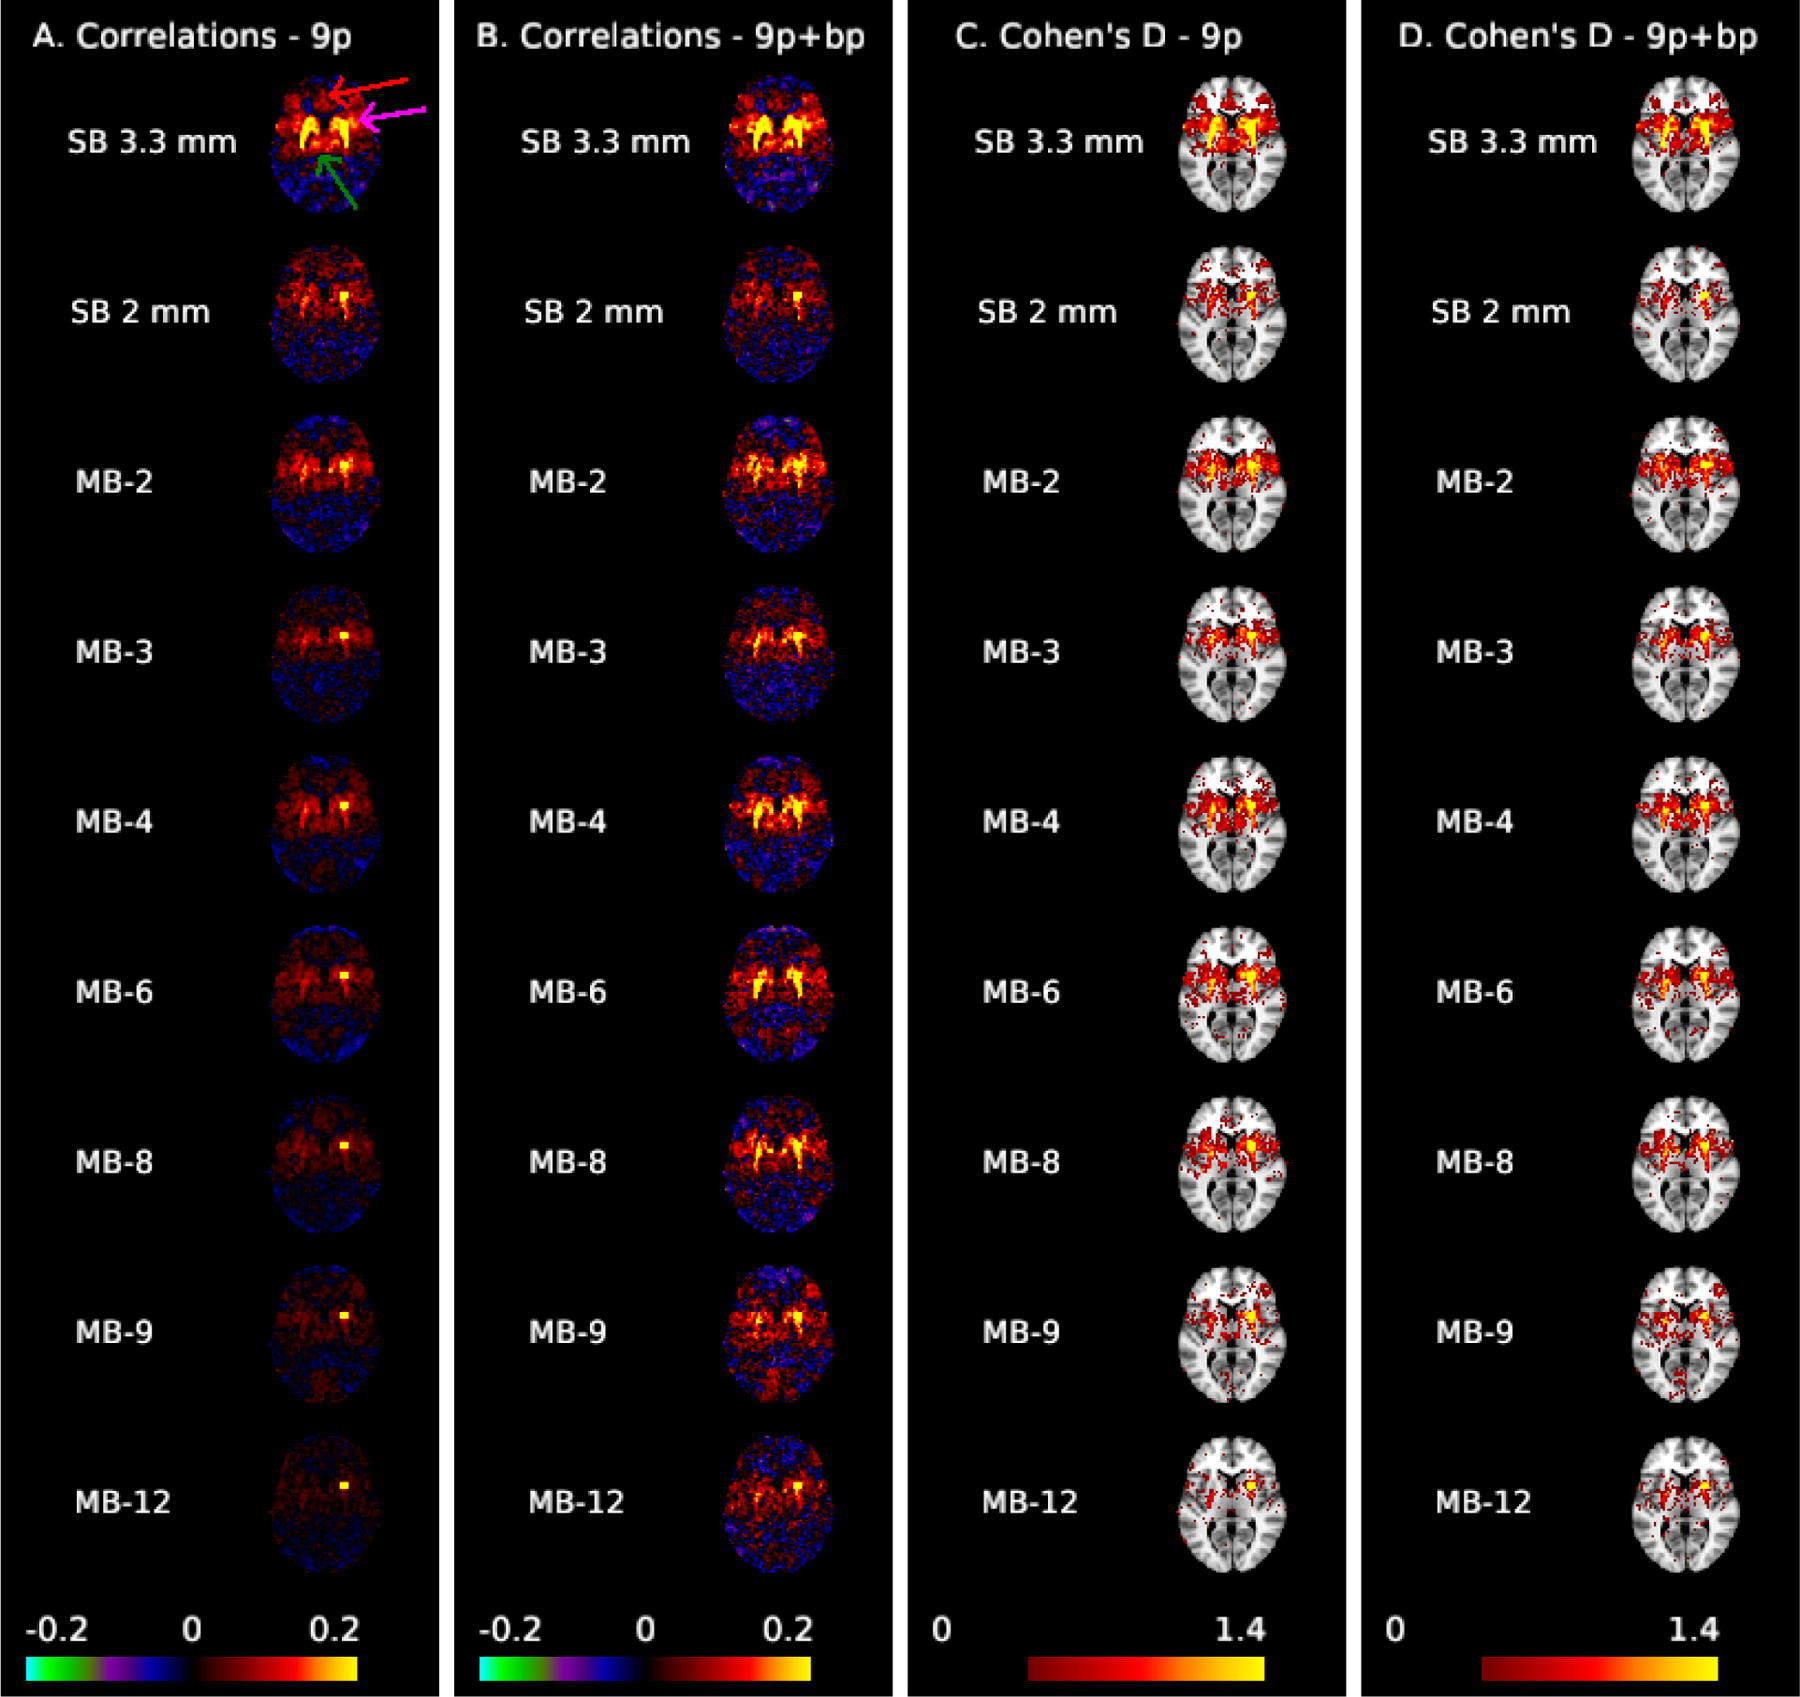
Figure 2:

Correlation (A,B) and Cohen’s d maps thresholded to display values >0.4 (C,D) for the dorsal rostral putamen seed (MNI: 25, 8, 6) shown at MNI axial slice 6. The arrows in column A highlight the cingulate cortex (red), insula (fuchsia), and thalamus (green). Spatial biases in the correlations increase as MB factor increases; ipsilateral correlations with the thalamus and insula, as well as contralateral correlations are not apparent for MB 8 and higher in preprocessing without temporal filtering (A). These biases are reduced with bandpass filtering (B), which results in clear left-right putamen functional connectivity in MB 2 to MB 8. Effect sizes are larger in single-band 3.3 mm.
