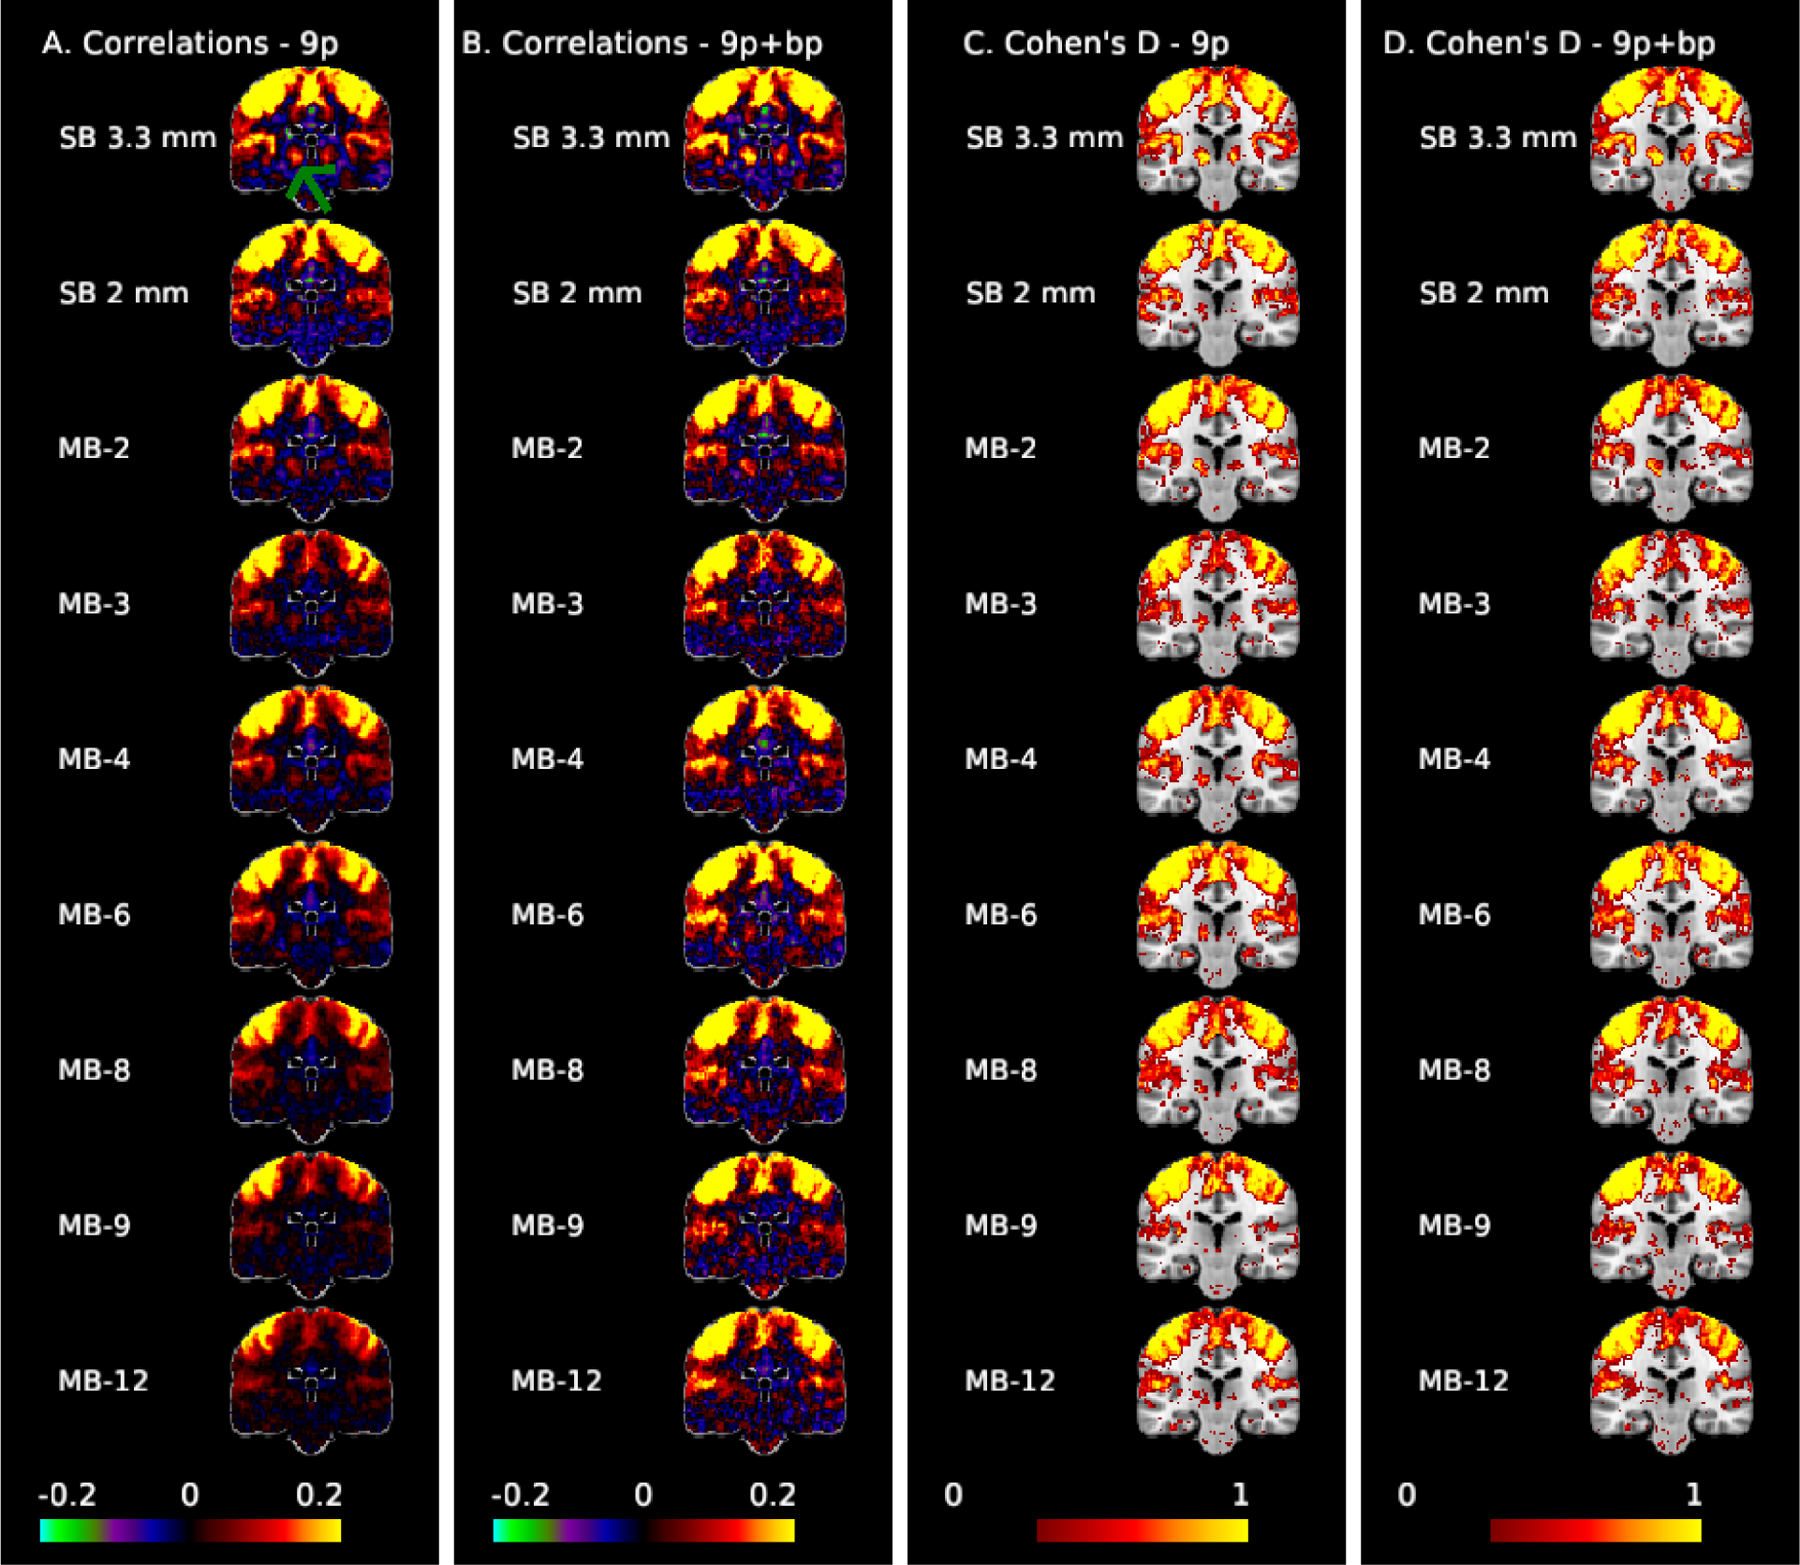
Figure 3:

Correlation (A,B) and Cohen’s d maps thresholded to display values >0.3 (C,D) for the motor seed (MNI: −41, −20, 62) at coronal slice −24 to examine motor-thalamic pathways. The green arrow points to the thalamus. Thalamocortical connectivity is clearly apparent in the SB 3.3 mm acquisition, with smaller but notable effect sizes in the MB 2 to MB 6 acquisitions.
