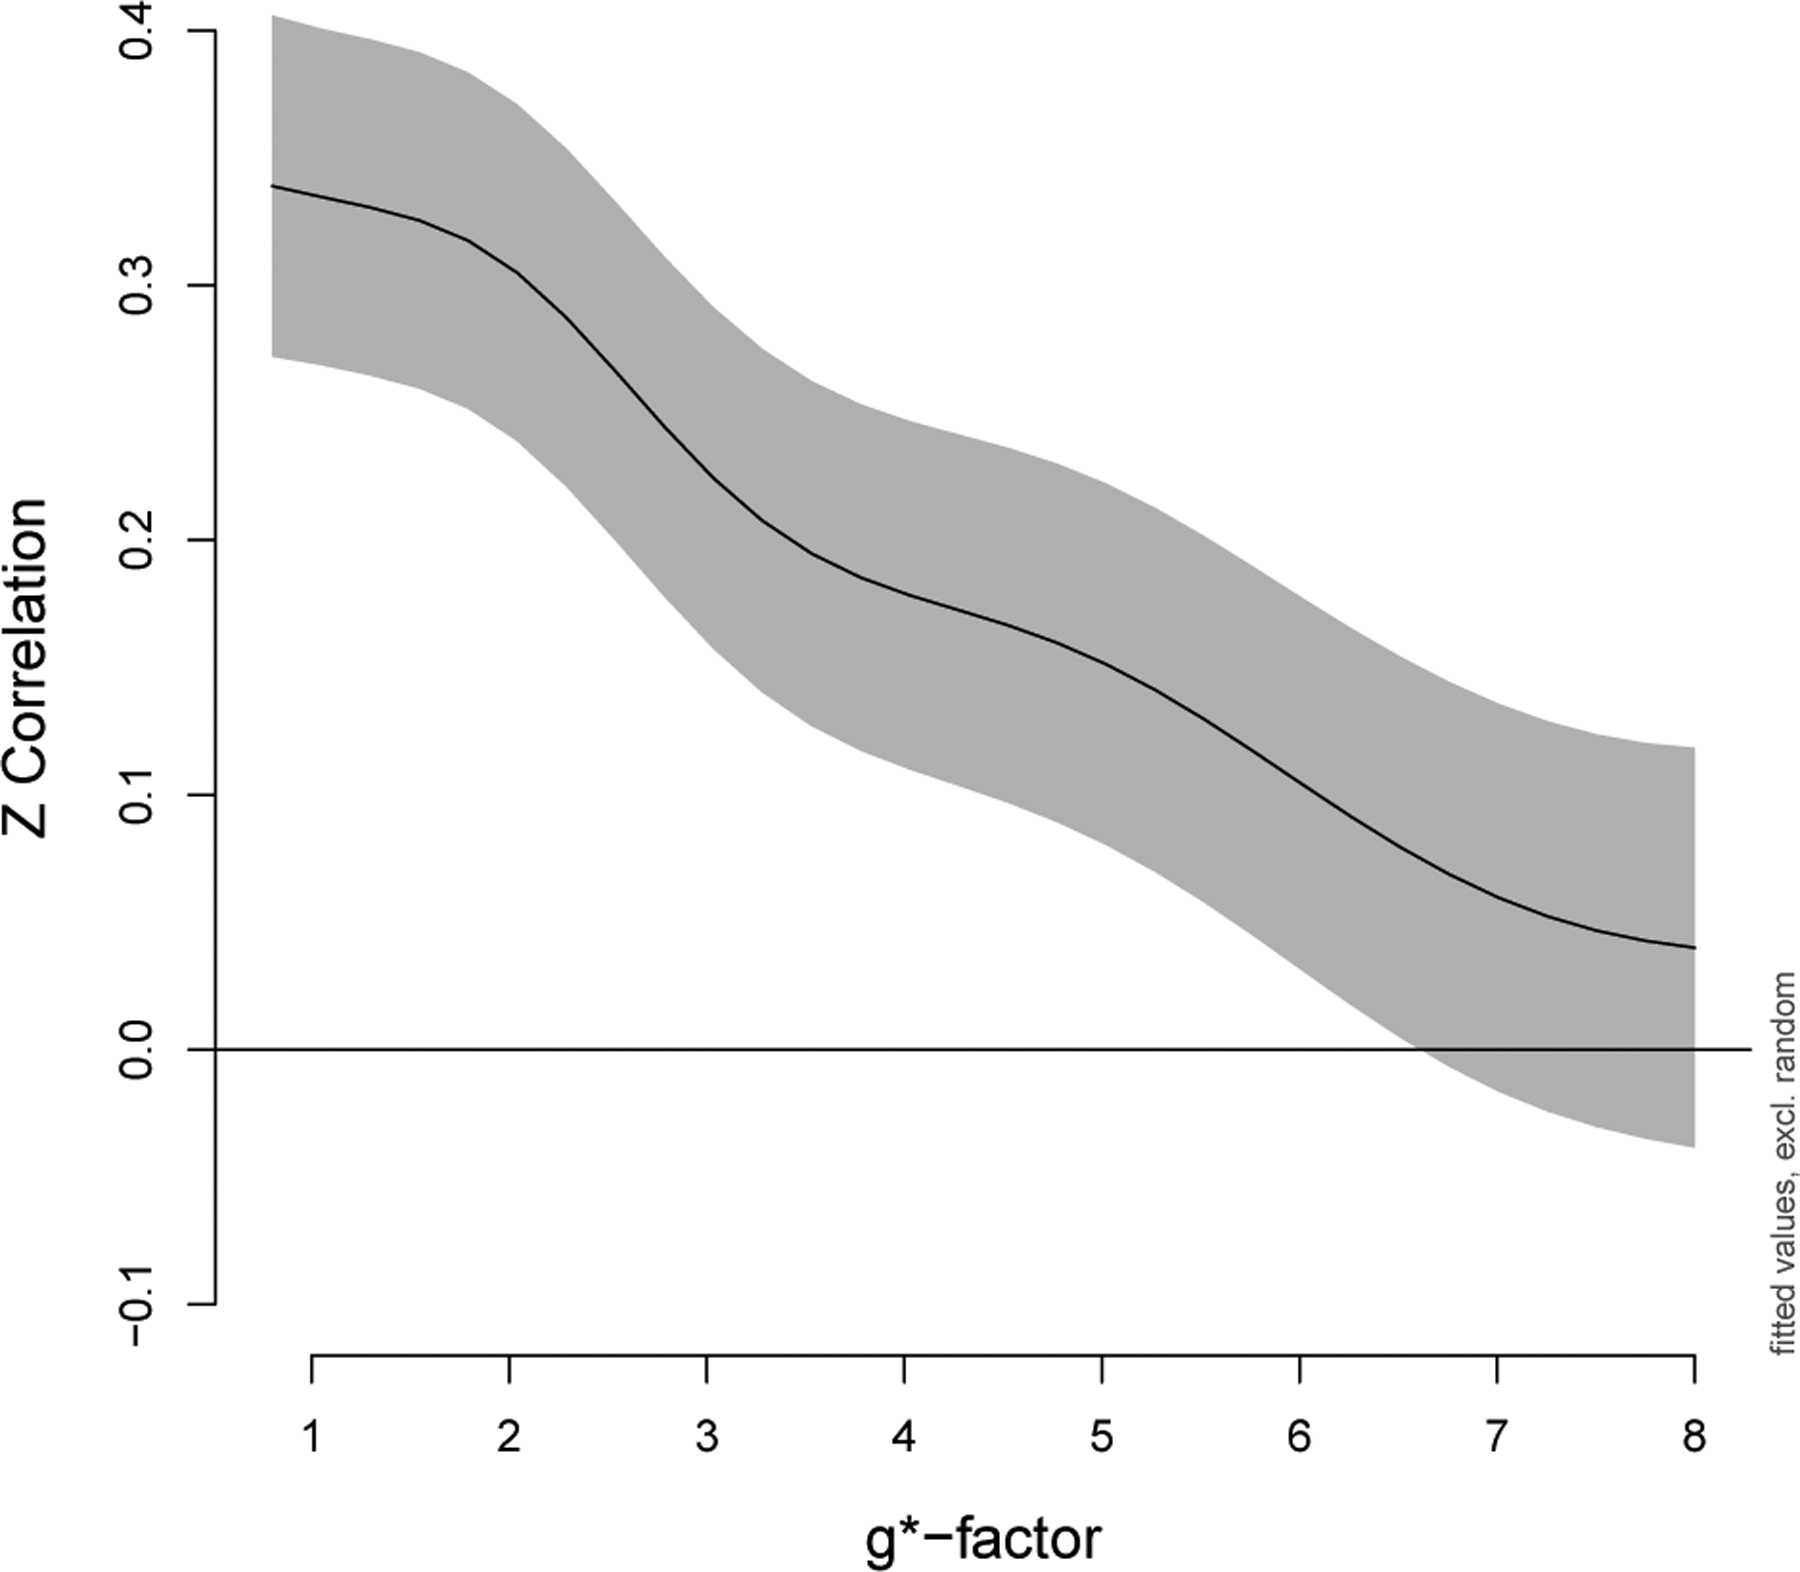
Figure 5:

Correlations decrease as noise amplification increases. Fisher z-transformed correlations in a subset of edges that were a priori expected to have positive correlations, as described in Section 3.5.1 Impacts on the magnitude of correlations, were analyzed using a generalized additive mixed model. The overall effect of g*-factor was highly significant (p < 0.001). The GAMM includes a smoother for g*-factor with penalty selected using REML, fixed effects for edge, gender, and scanner, and random effects for participant and participant × edge. The y-intercept in this figure corresponds to the edge with median correlation (nodes 92 and 109, default mode). Gray indicates point-wise 95% confidence intervals.
