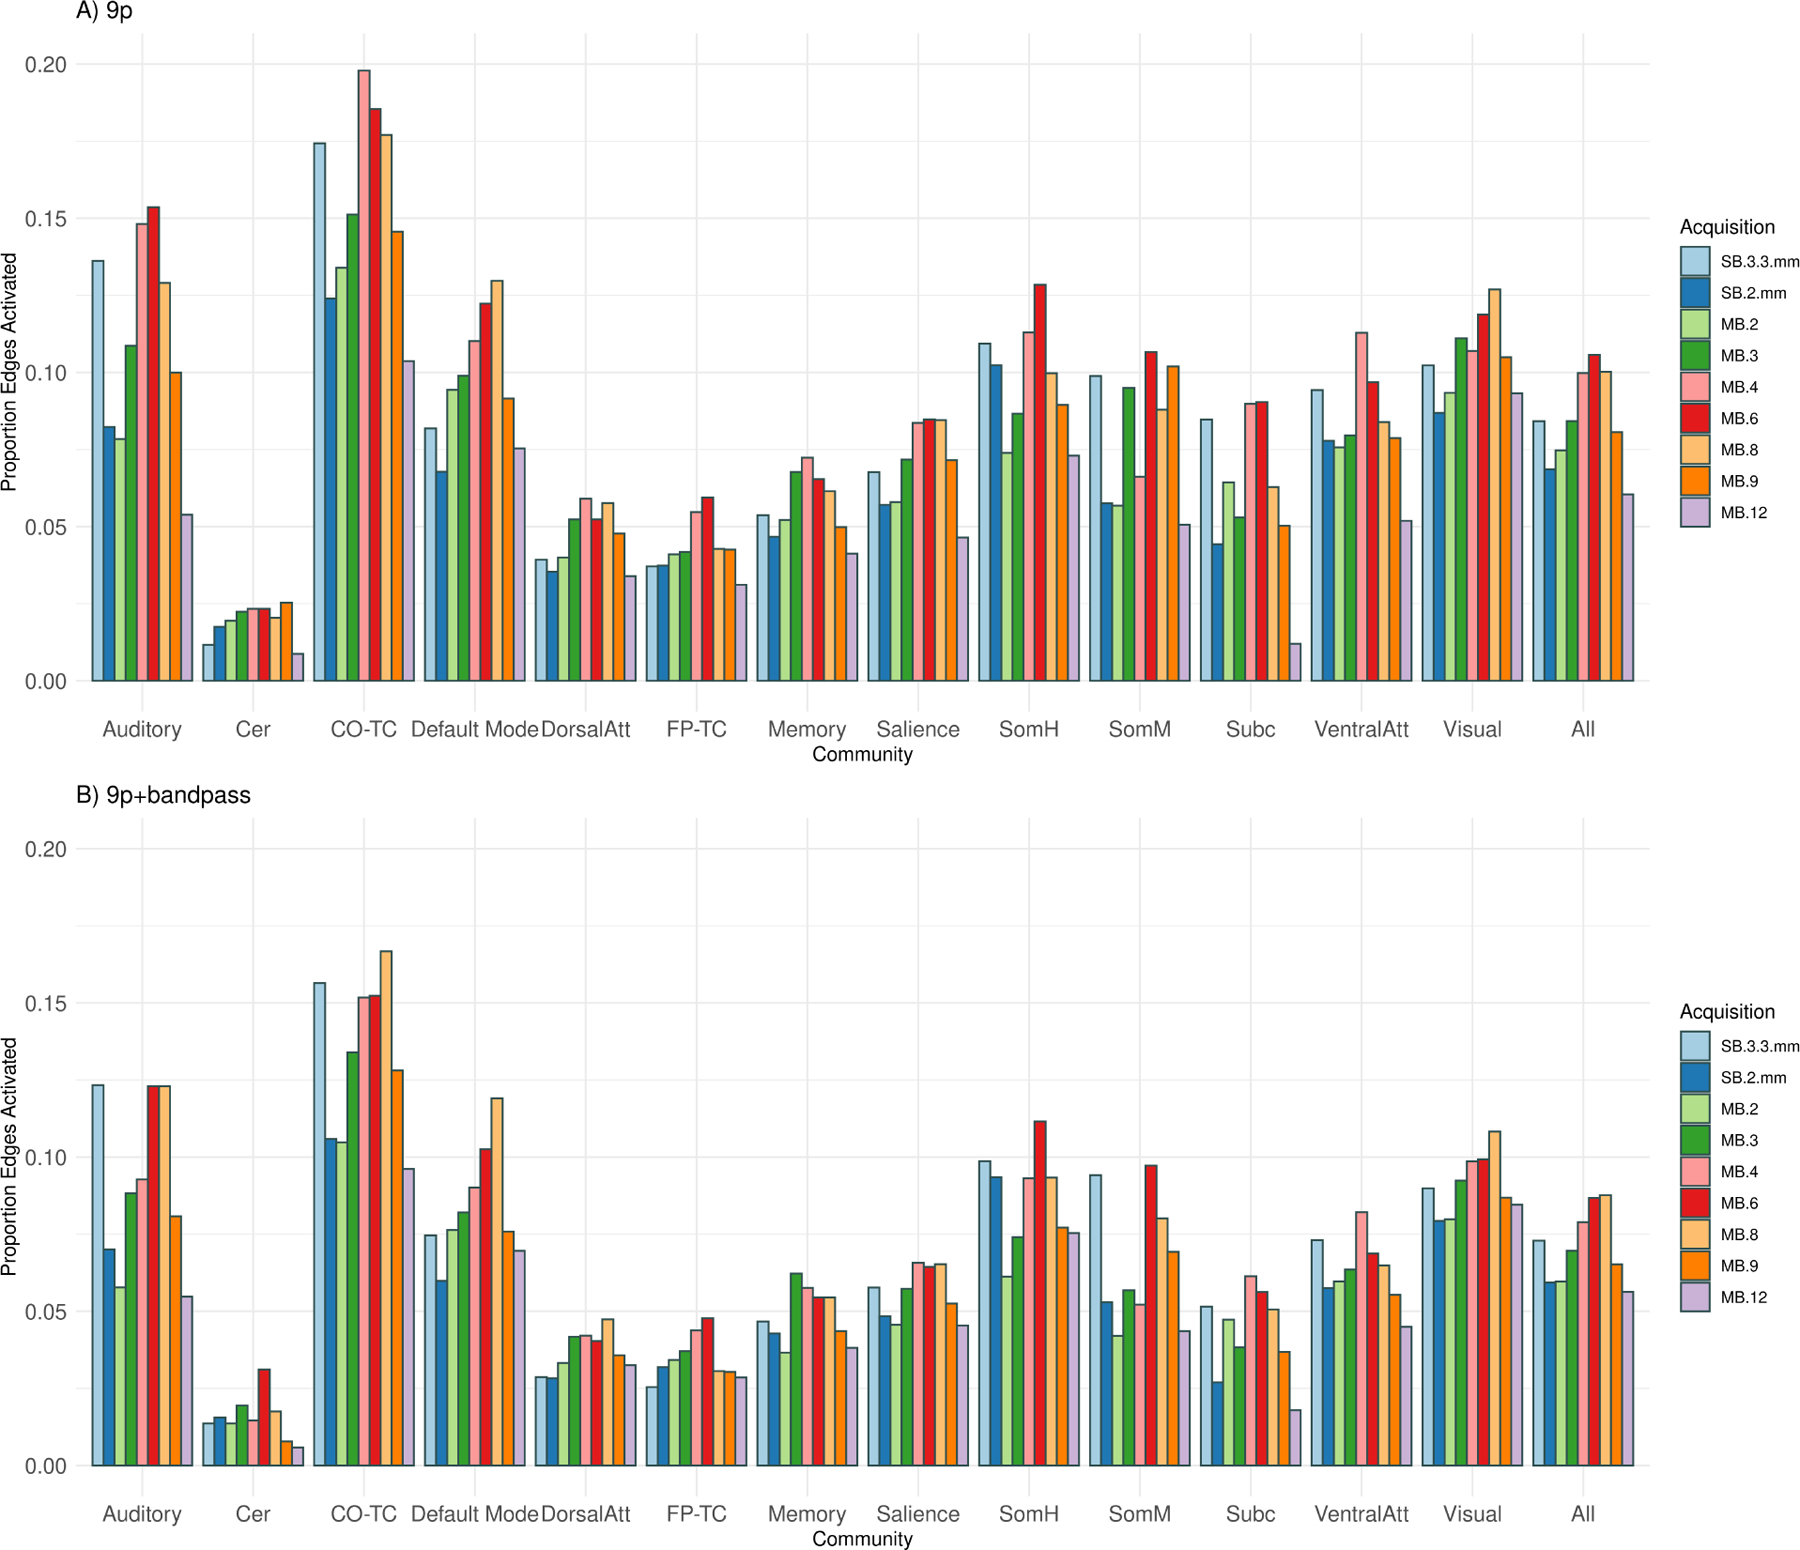
Figure 7:

Edge density (number of significant correlations) for thirteen communities (auditory, cerebellum, cingulo-opercular task control, default mode, dorsal attention, fronto-parietal task control, memory, salience, somatomotor hand, somatomotor mouth, subcortical, ventral attention, and visual) and across all edges (all). The edge density for a community is defined as the proportion of significant one-sample t-statistics (using the Bonferroni-corrected α-level) for the Fisher z-transformed correlations for each edge in which at least one of the nodes is in the community. A) The number of significant correlations with 9p preprocessing tended to be higher in MB 6, MB 4, and MB 8, with the relative ranking of SB 3.3 mm depending on the community, and SB 2 mm, MB 2, MB 3, MB 9, and MB 12 tending to perform worse. Permutation tests of significant differences between MB factors appear in Web Supplement Table S.2. Similar results were obtained with 9p+spatial smoothing, shown in Web Supplement Table S.3. B) The rankings with 9p+bandpass were similar to 9p, with MB 8, 6 and 4 tending to be higher than others and SB 2 mm, MB 2, MB 9, and MB 12 lower. Permutation tests of significant differences between MB factors appear in Web Supplement Table S.4. Overall, 9p+bandpass had lower edge density compared to 9p, with significant differences displayed in Web Supplement Table S.5.
