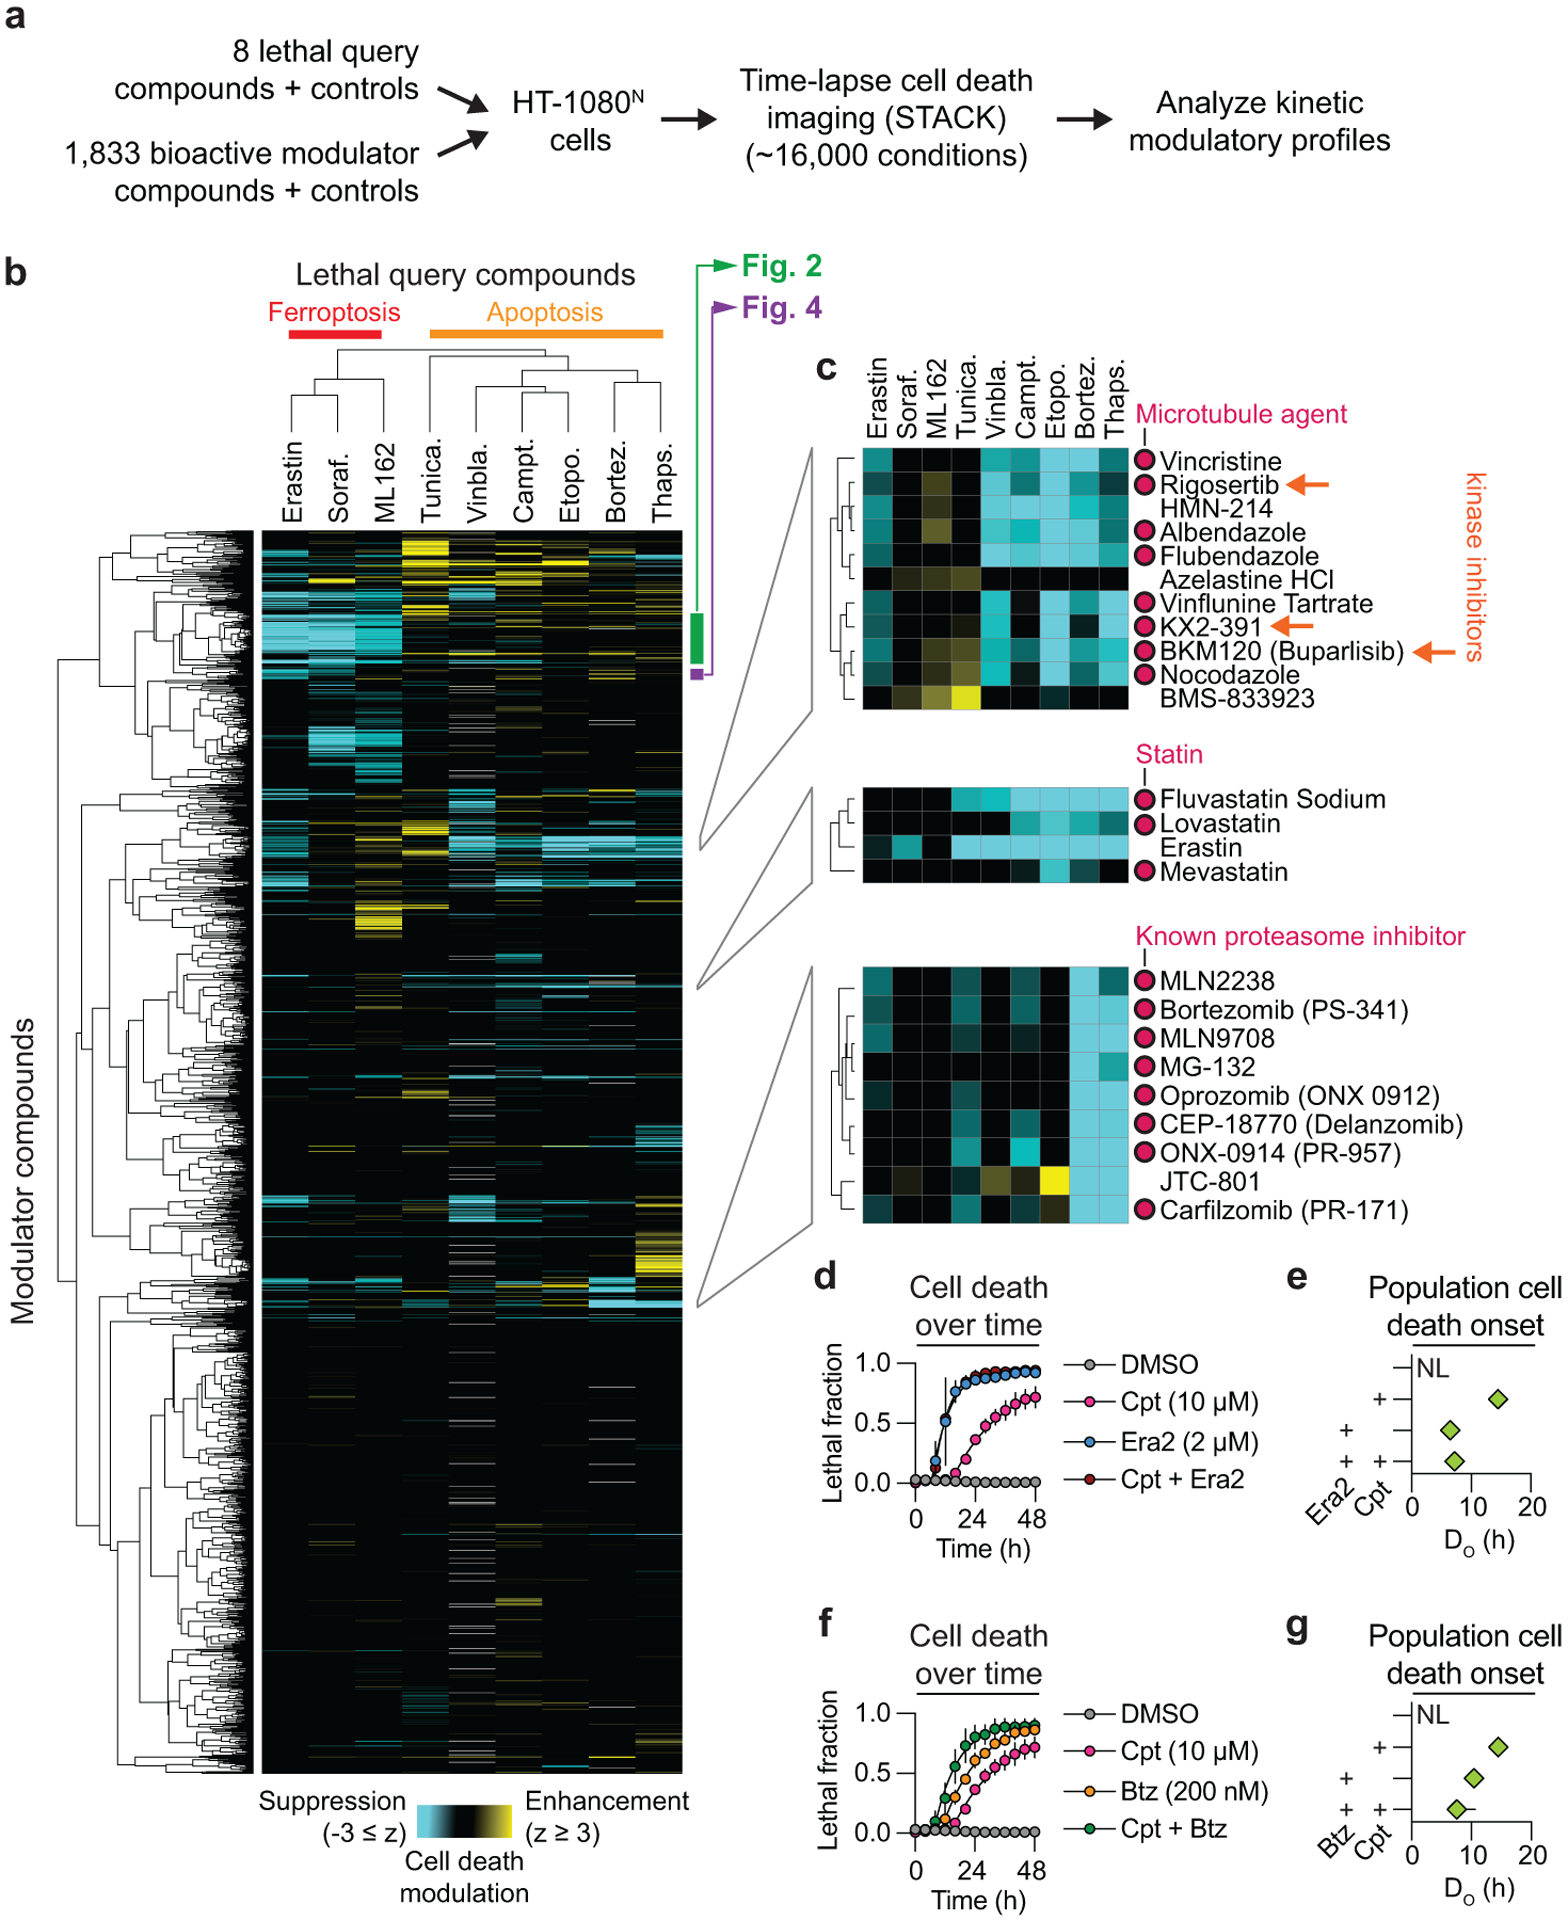
Figure 1. A kinetic modulatory profile.

a, Overview of the kinetic modulatory profiling analysis and compendium generation. b, Deviation z-scores between the expected and observed effect of each compound combination in the compendium are plotted as a heat map. Grey cells indicate no data available. c, Three heatmap sub-clusters of interest. Orange arrows indicate kinase inhibitors that bind tubulin as off-targets. d, Cell death in HT-1080N cells as determined using STACK. Cpt: camptothecin, Era2: erastin2. e, Time of population cell death onset (DO)12 for treatments shown in d. NL: not lethal. f, Cell death in HT-1080N cells as determined using STACK. Btz: bortezomib. g, DO values for treatments shown in f. Note that the DMSO and Cpt data shown in d-g are from the same experiment. Results in d,f are mean ± SD from three independent experiments. Results in e,g are mean ± 95% confidence interval, derived from the curves in d and f, respectively.
