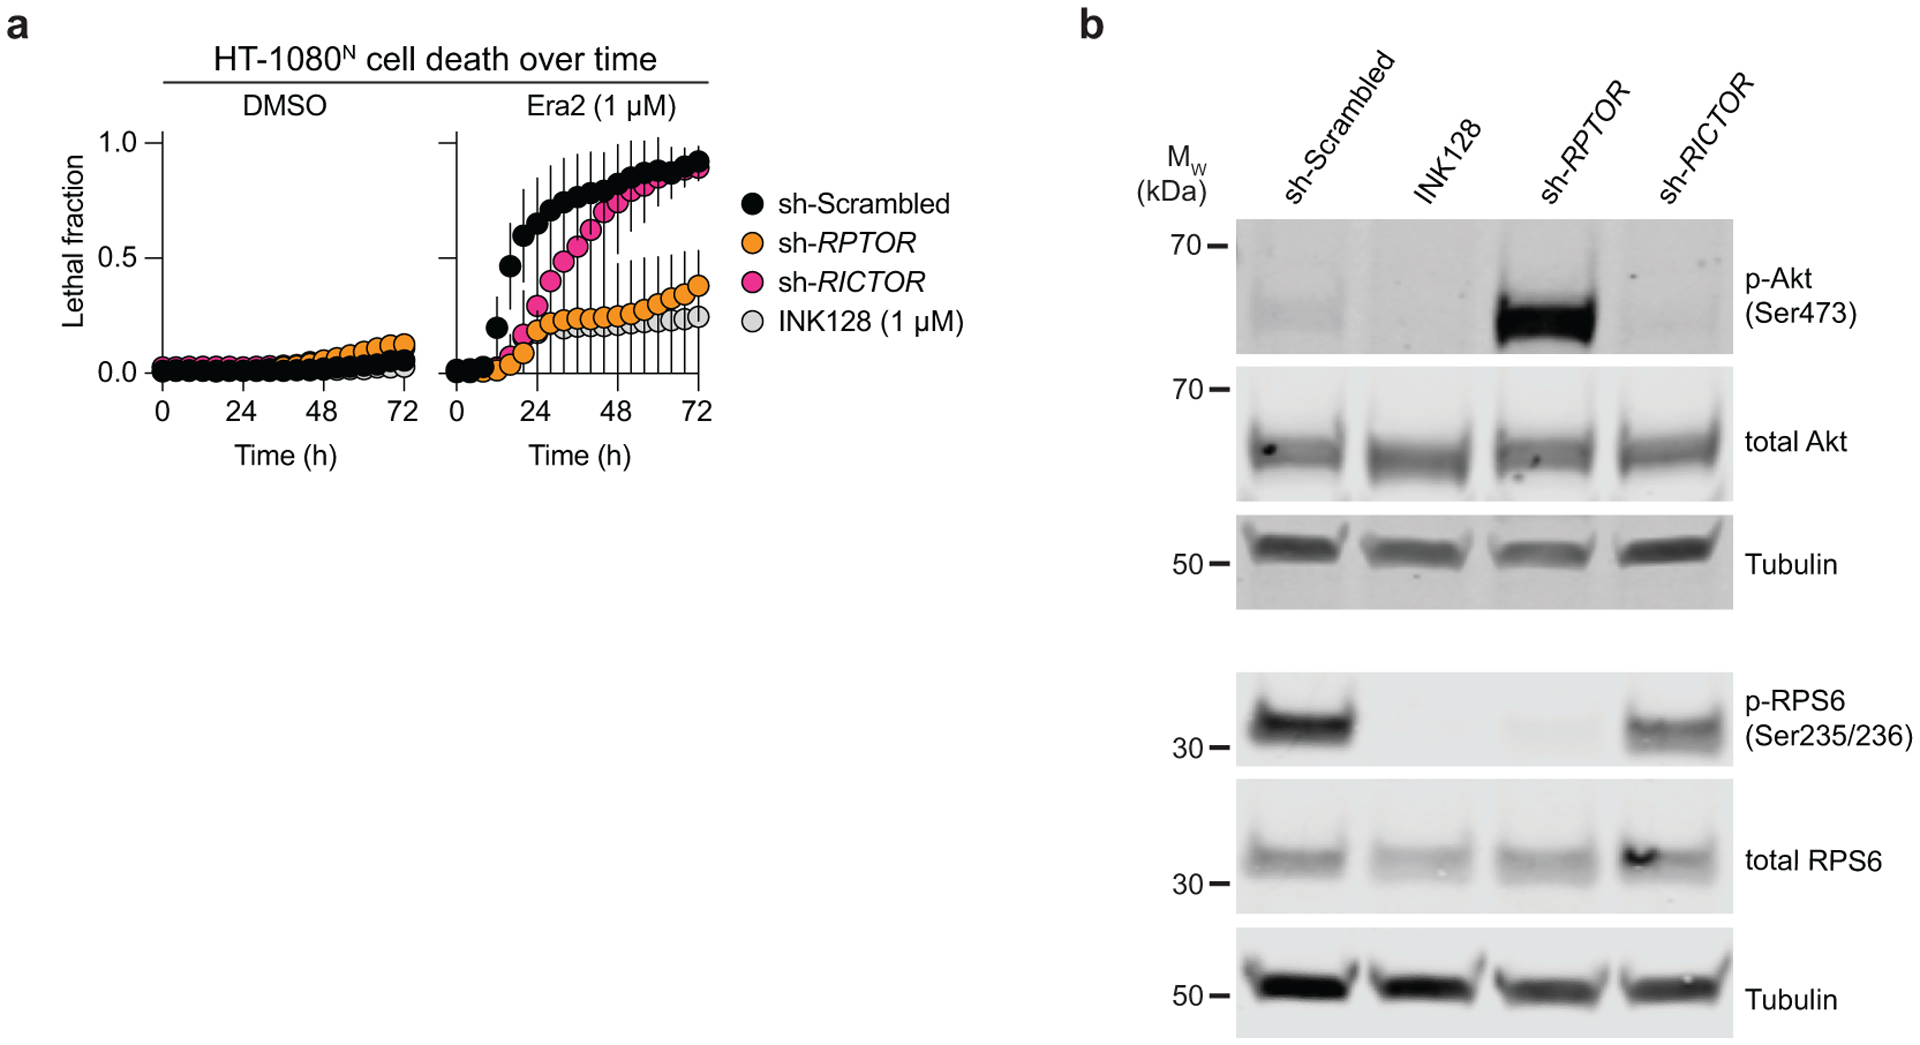
Extended Data Fig. 6. mTOR regulates ferroptosis sensitivity.

a, Cell death over time determined using STACK. Cells were infected with control (scrambled) shRNA or shRNAs targeting RPTOR or RICTOR for 72 h prior to compound treatment. INK128 was used as a positive control. Results are mean ± SD from three independent experiments. b, Expression and phosphorylation of proteins in the mTOR pathway following infection of HT-1080 cells as in a for 48 h. Blot is representative of three independent experiments.
