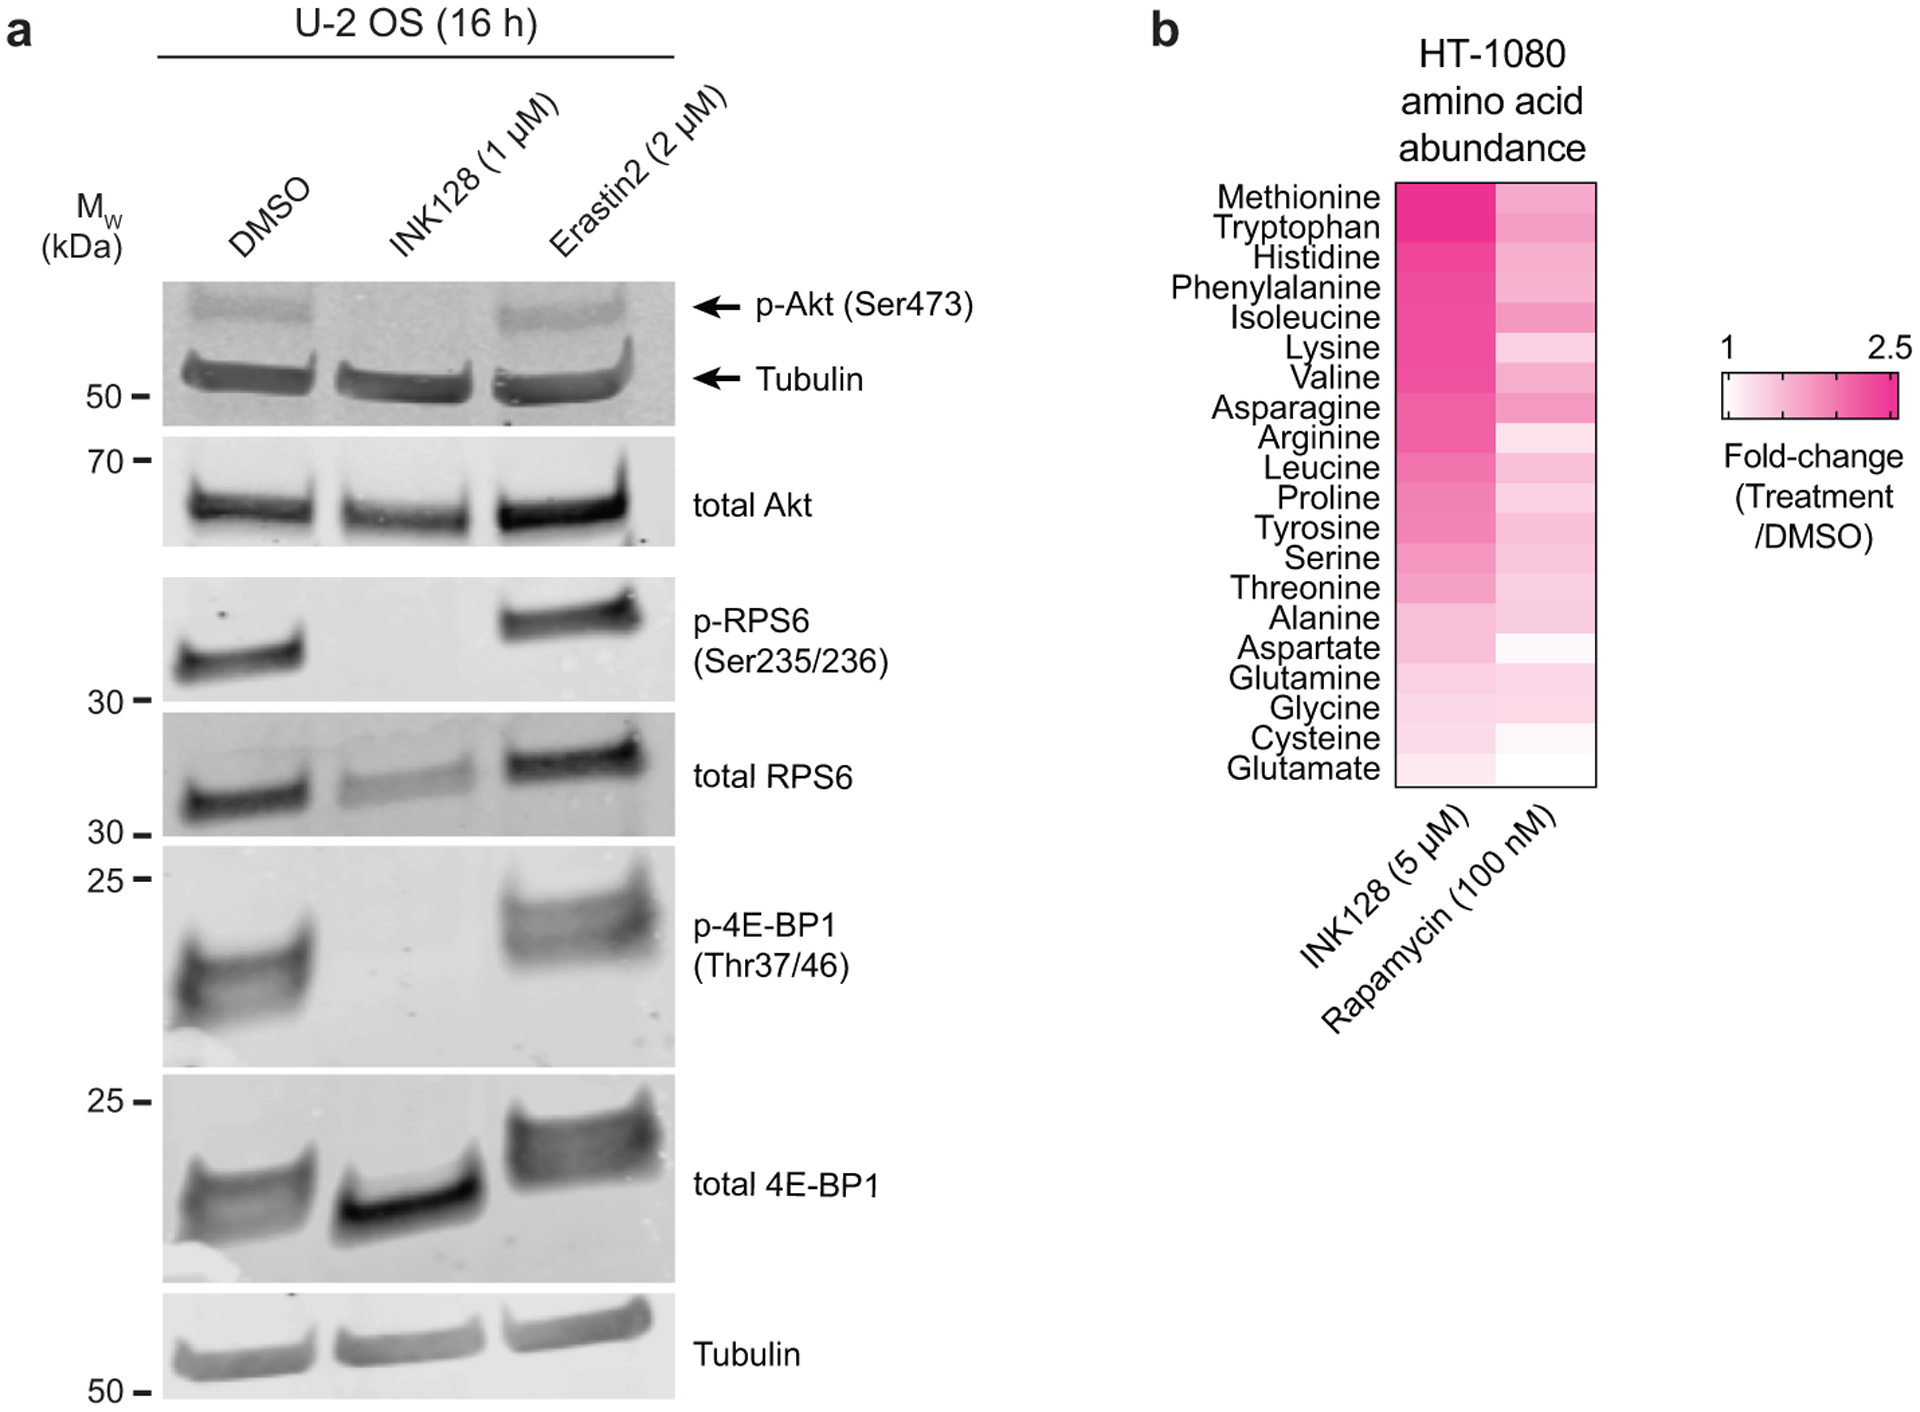
Extended Data Fig. 9.

a, Phosphorylation and levels of mTOR pathway effectors. Blot is representative of three independent experiments. b, Fold-change in amino acids levels in HT-1080 cells determined using liquid chromatography coupled to mass spectrometry.
