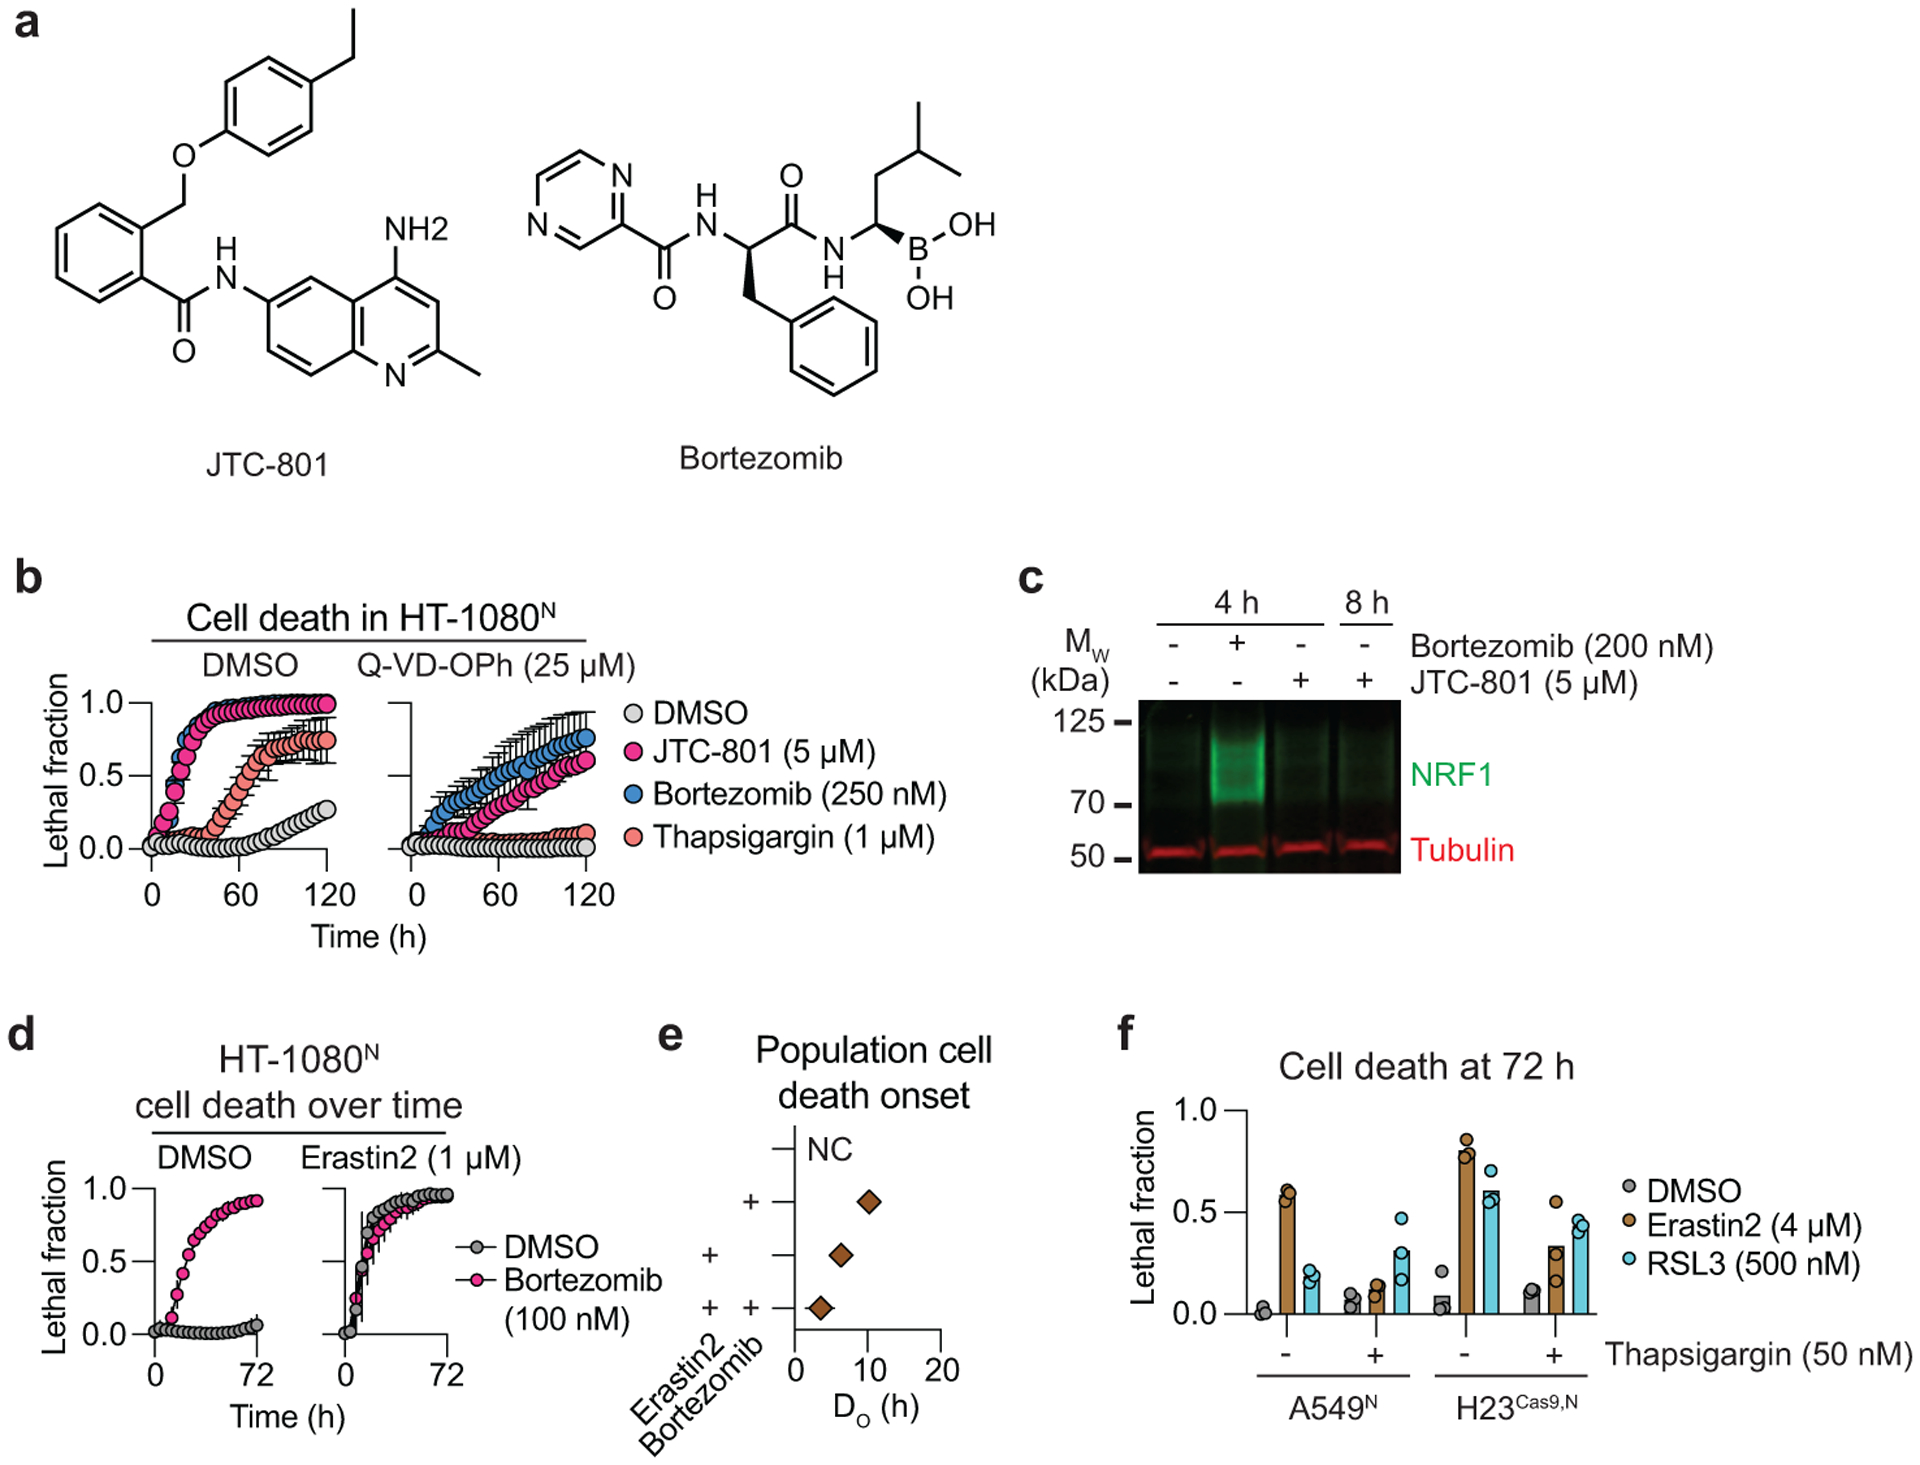
Extended Data Fig. 1. Examination of compound interactions on cell death.

a, Chemical structures. b, Cell death determined using STACK. c, NRF1 (NFE2L1) protein levels. Blot is representative of three independent experiments. d, Cell death determined using STACK. e, Quantification of the timing of population cell death onset (DO) from the lethal fraction curves in d. f, Cell death in two different cell lines determined using STACK. Results in b, d and e are mean ± SD from three independent experiments, while in f results are from two or three independent experiments.
