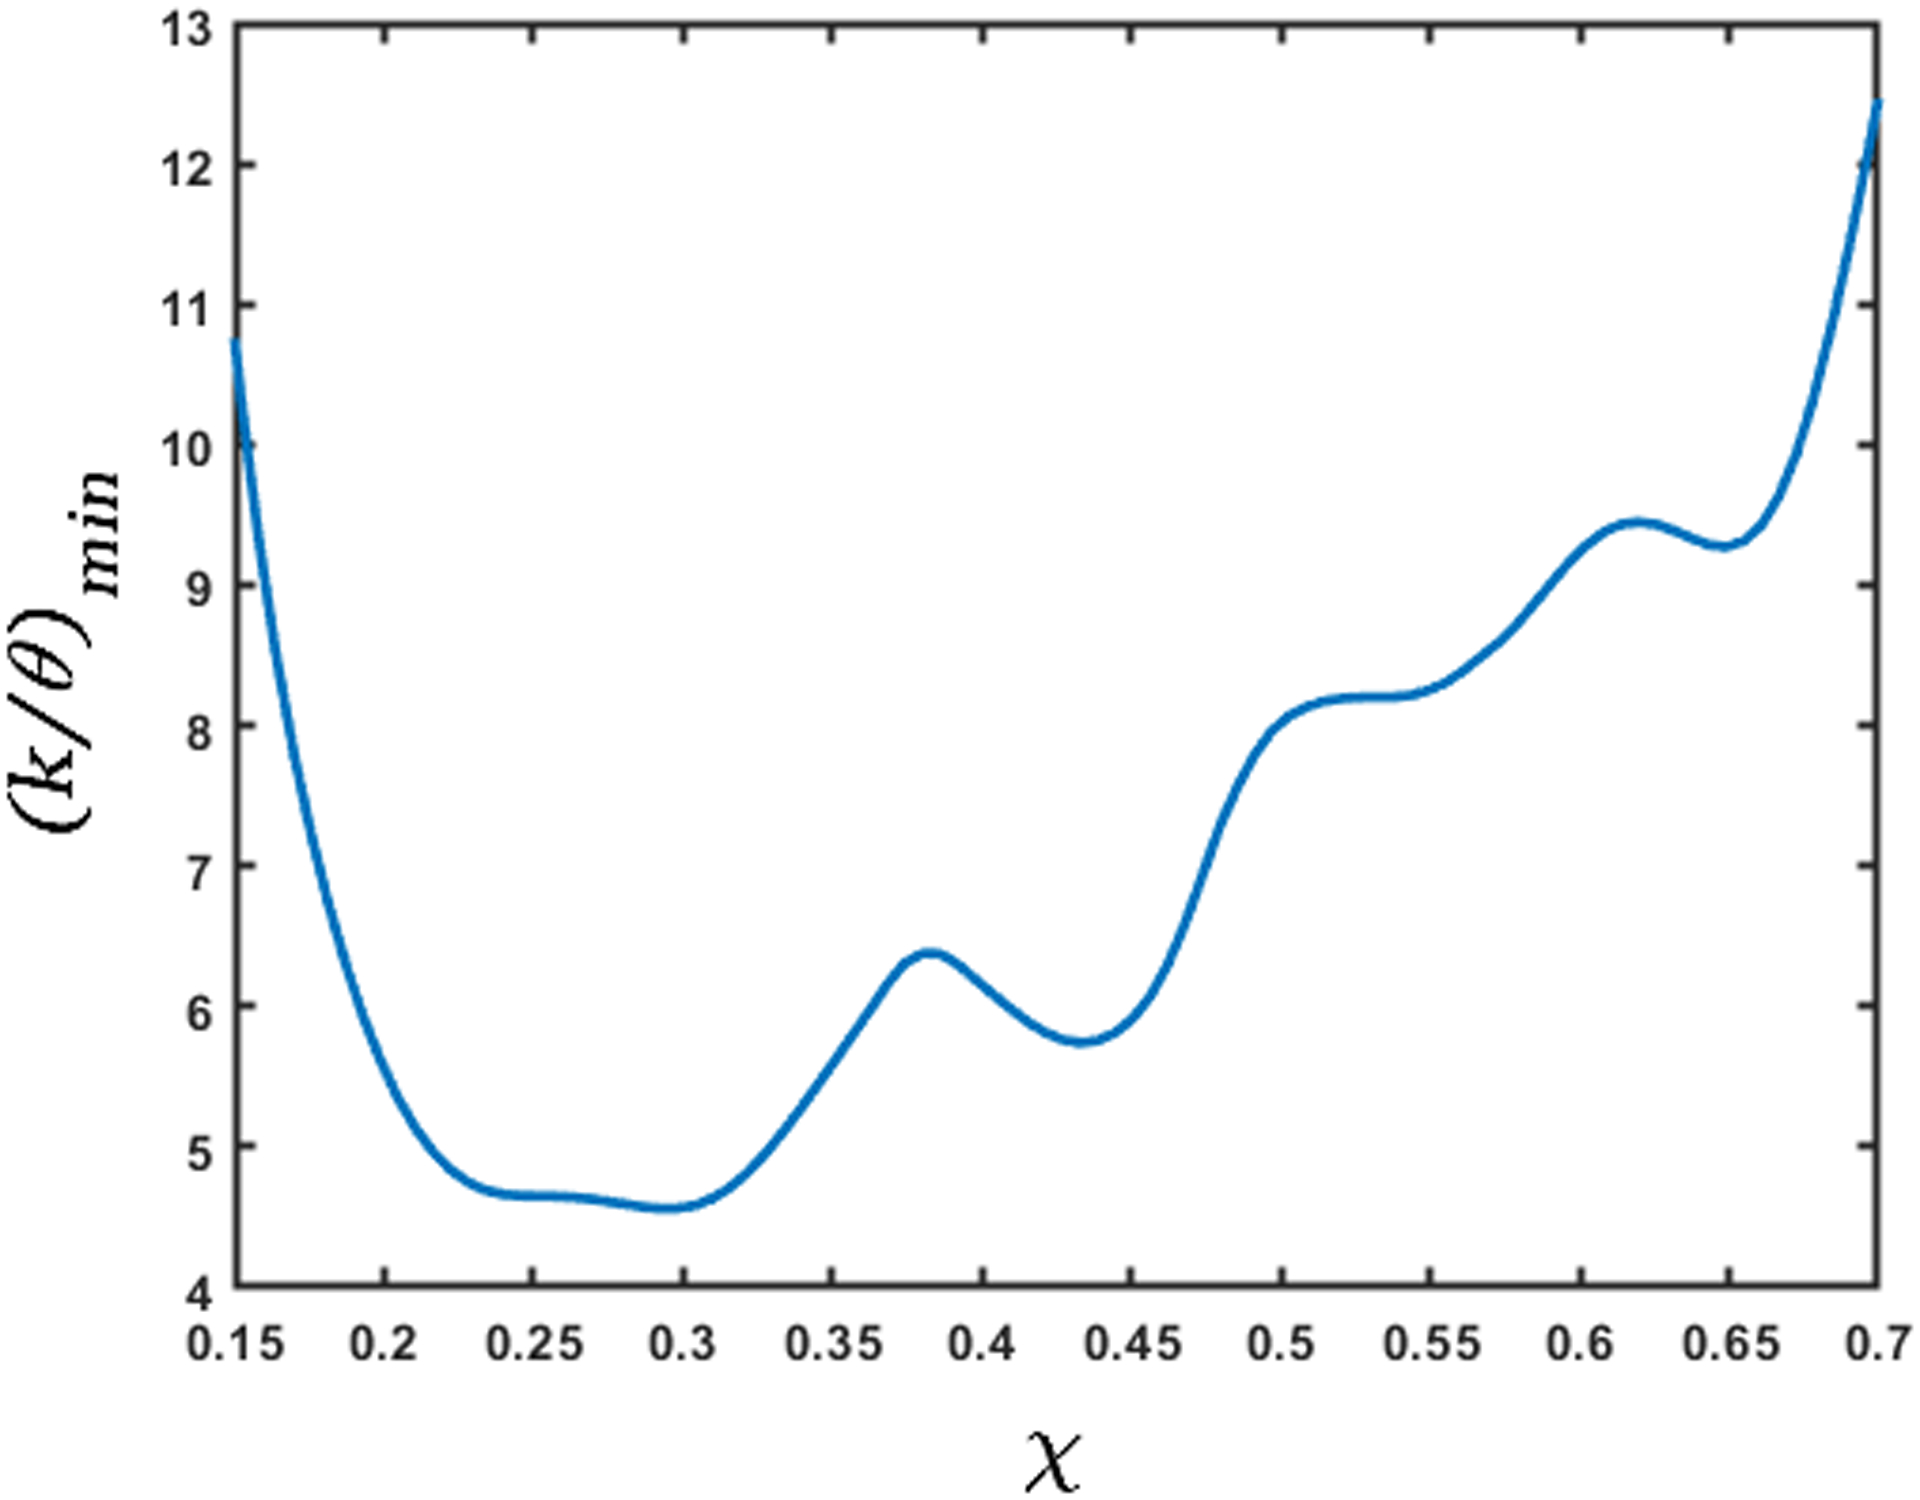
Figure 14:

Variation of minimum stiffness (in mmHg) along the length of the esophagus. The x-axis represents the length of the esophagus marked by the dashed horizontal lines in Fig. 13. This measure of stiffness incorporates the effect of active relaxation; therefore, its low values correspond to the high values of cross-sectional areas. The predicted high stiffness at χ = 0.15 and 0.7 is due to the influence of the peristaltic contraction and the LES, respectively.
