
Figure 4:
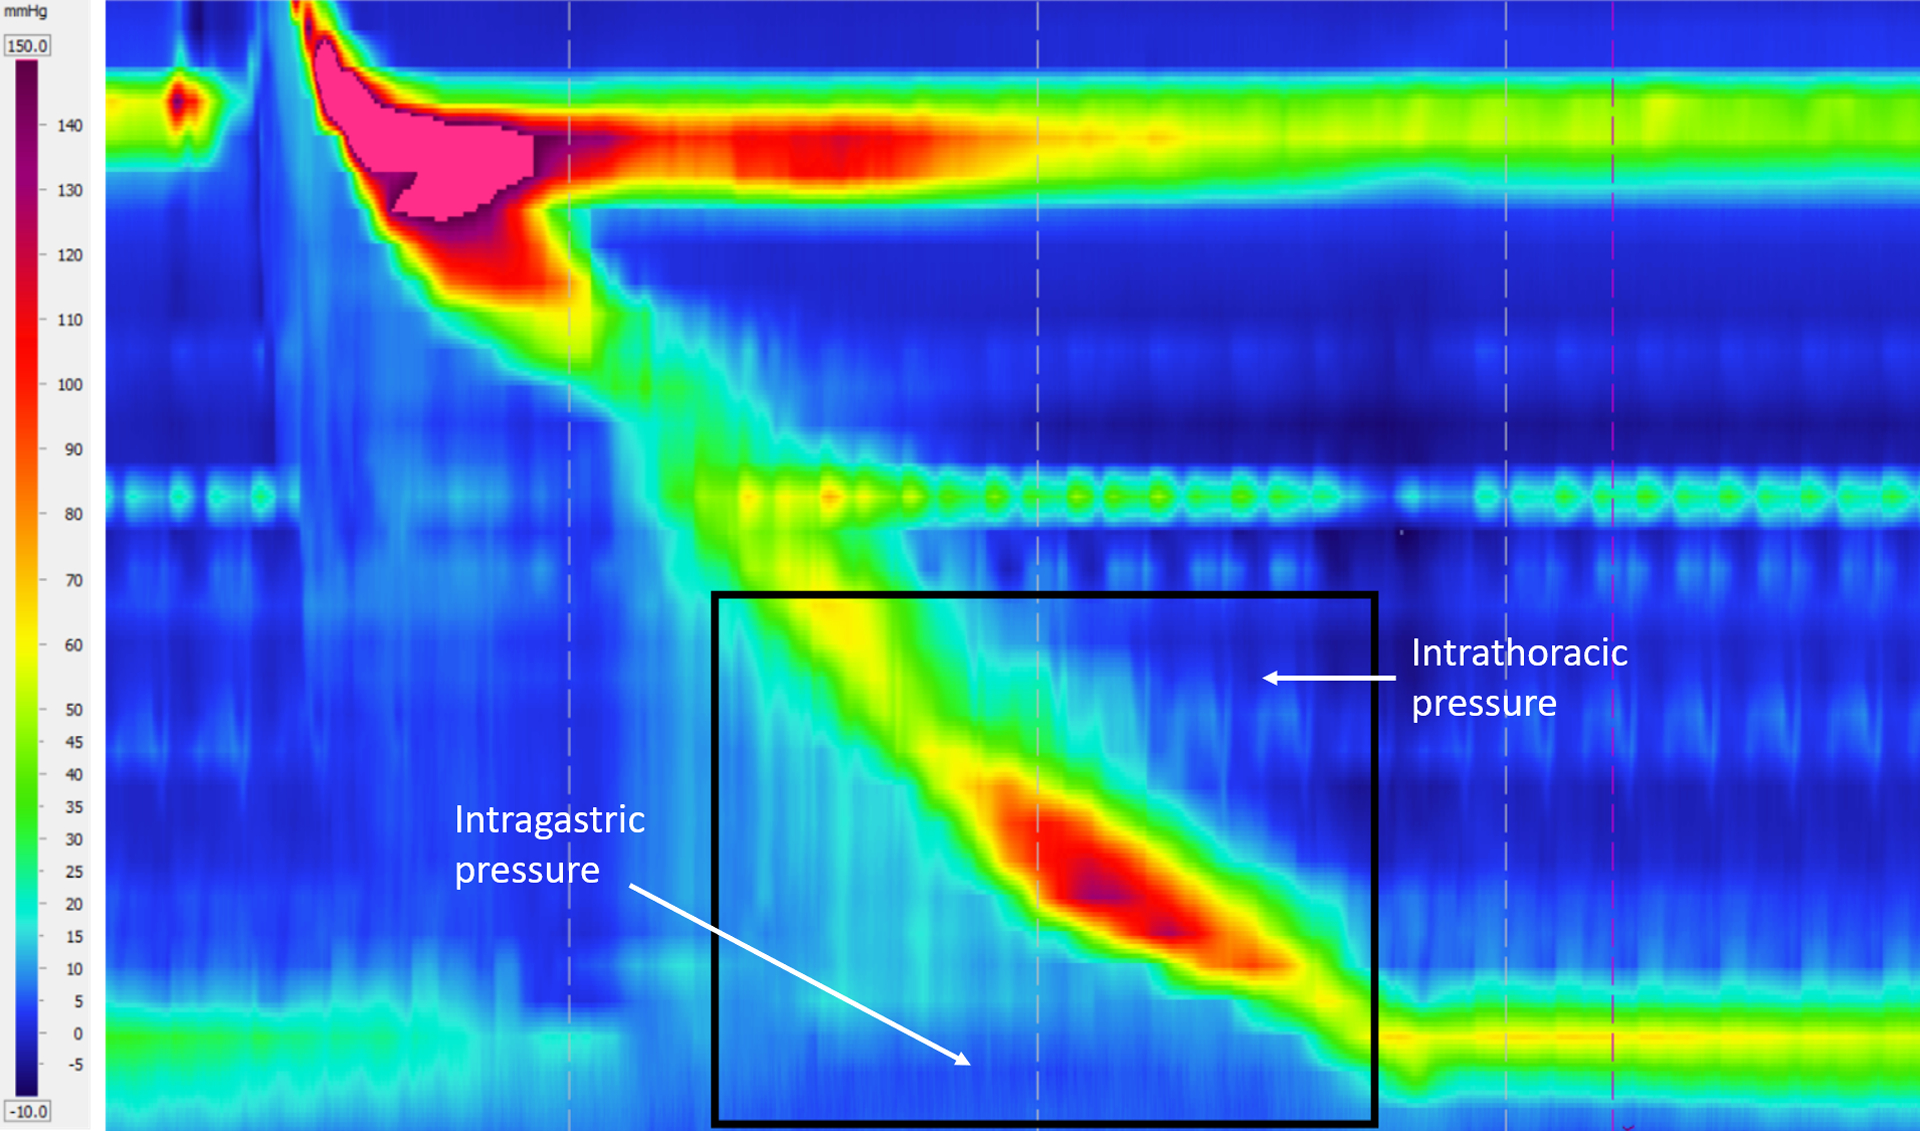
Esophageal pressure topography generated from pressure sensors on the HRM catheter. The horizontal axis represents time, and the vertical axis represents the length along the esophagus. The rectangular box shows the location of the EPT corresponding to the fluoroscopy. The horizontal high-pressure band (in red) at the top and bottom show the UES and LES tone, respectively. The peristaltic contraction is shown by the oblique high-pressure band that travels from the UES to the LES to push the bolus through the esophagus.