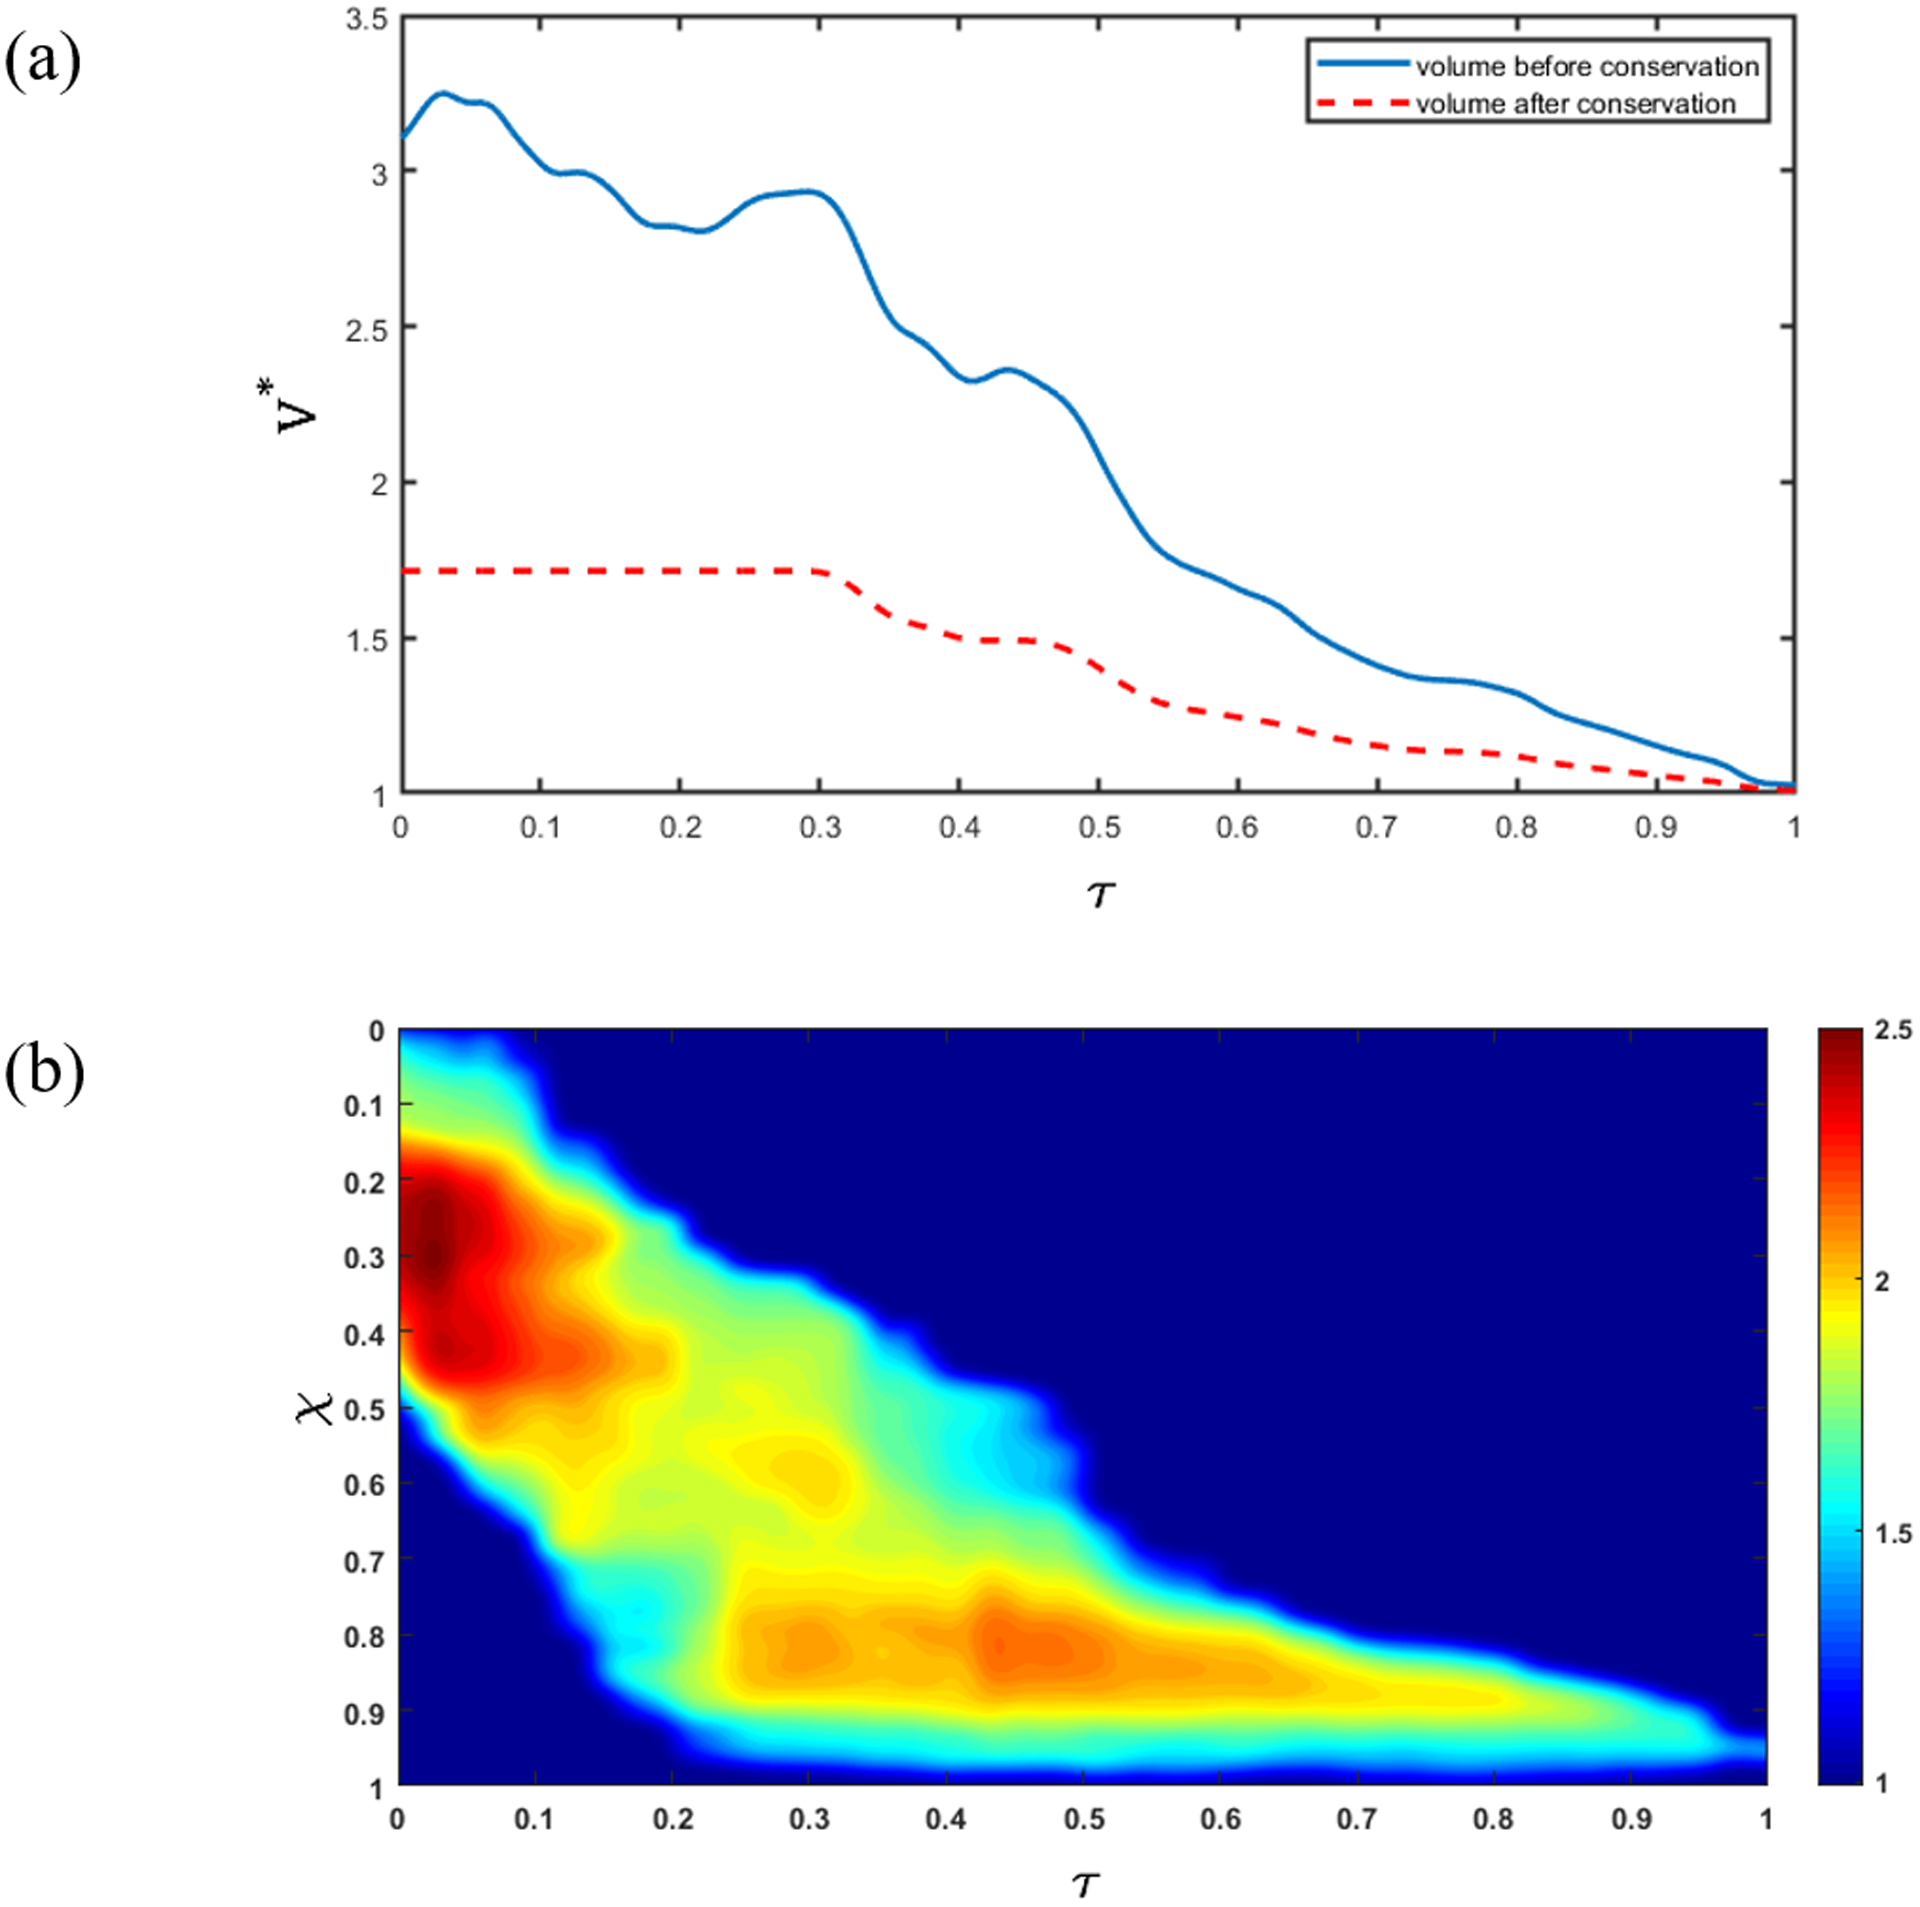
Figure 5:

Enforcing volume conservation. (a) Non-dimensional volume (V ^ *) inside the esophagus. The blue line shows the total volume of fluid inside the esophagus calculated assuming a bolus with a circular cross-section with diameter obtained from the bolus width observed in the segmented images. The red dashed line shows the total volume inside the esophagus after volume correction using the fact that the swallowed bolus is 5 mL; (b) Ratio of the initially assumed circular cross-sectional area (A) and the corrected cross-sectional area (A ^ *). The oblique band of high cross-sectional area correction shows that the correction is performed only inside the bolus, and not in the relaxed parts of the esophagus where .
