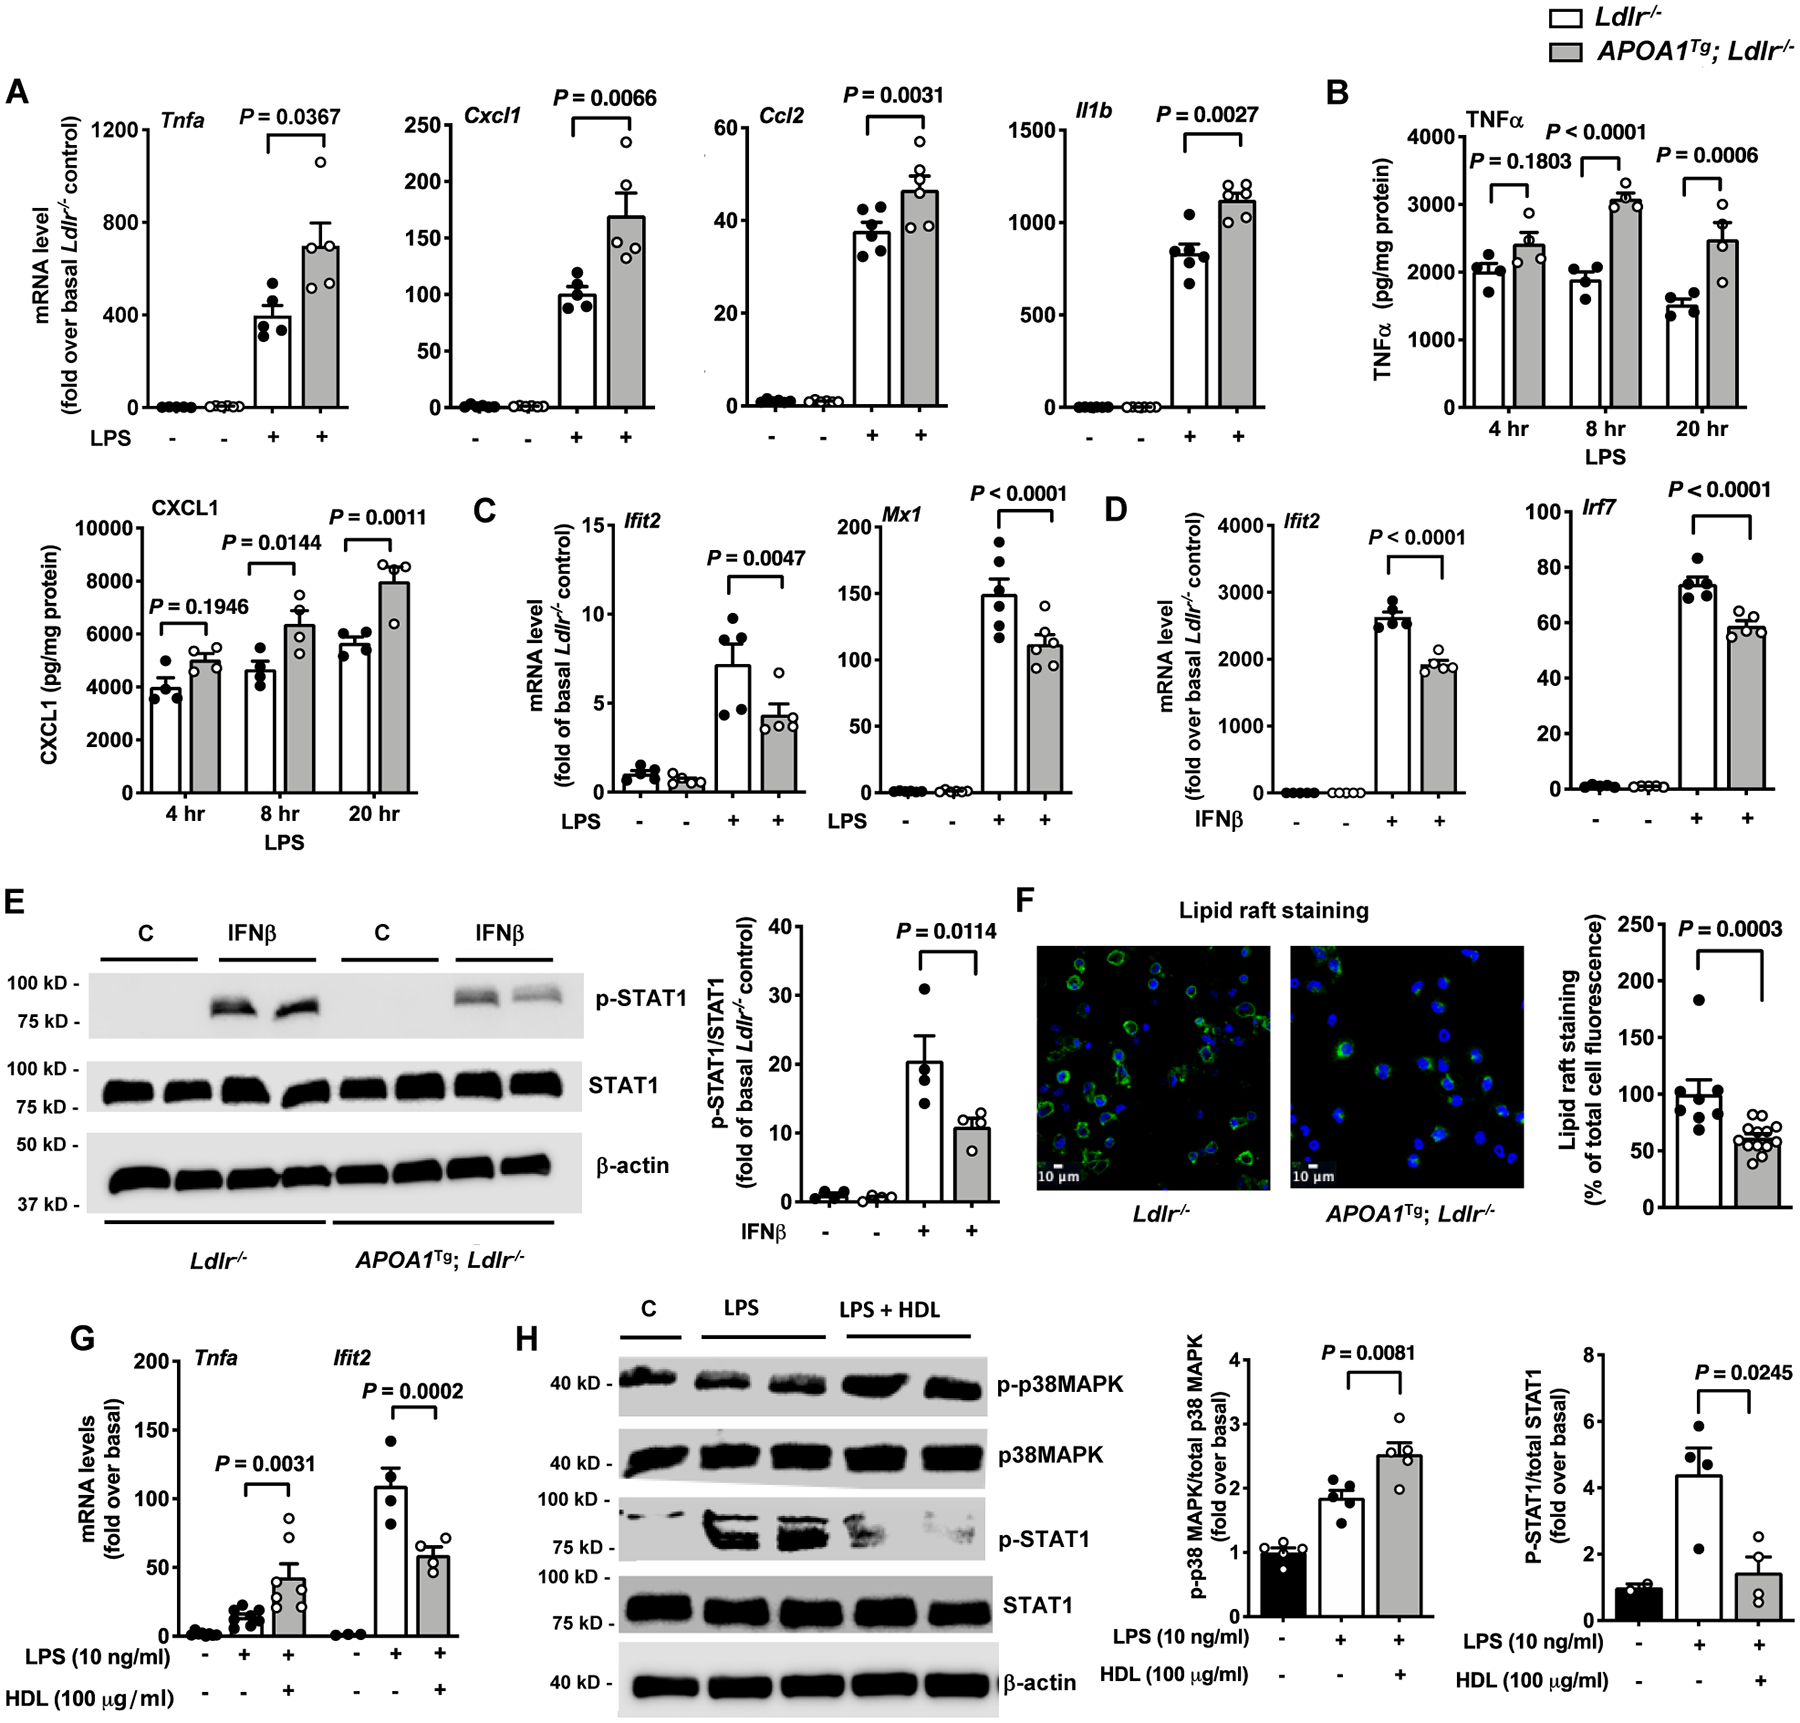
Figure 1. Pro-inflammatory and anti-inflammatory responses in macrophages from APOA1Tg; Ldlr−/− mice mimic those of HDL.

Peritoneal cells from male Ldlr−/− and APOA1Tg; Ldlr−/− control littermate mice were collected 4 days after thioglycolate injection. Macrophages were isolated from other cell types using a macrophage isolation kit and were further purified by a 1 hr adhesion protocol before stimulation with LPS or IFNβ. A. Effect of LPS (10 ng/ml, 4 hr) on inflammatory gene expression in macrophages isolated from Ldlr−/− and APOA1Tg; Ldlr−/− mice (n=5). B. Conditioned media were collected at indicated times from LPS-stimulated macrophages to analyze the release of TNFα and CXCL1 (n=4). C. Effect of LPS on the type 1 IFN-inducible genes Ifit2 and Mx1 analyzed in peritoneal macrophages from Ldlr−/− and APOA1Tg; Ldlr−/− mice (n=5–6). D. Effect of IFNβ on Ifit2 and Irf7 mRNA levels analyzed in peritoneal macrophages from Ldlr−/− and APOA1Tg; Ldlr−/− mice (n=5). E. Effect on STAT1 phosphorylation in IFNβ-stimulated peritoneal macrophages isolated from Ldlr−/− and APOA1Tg; Ldlr−/− mice (n=4). Phospho-STAT1 band intensity was normalized to that of total STAT1 and quantified (bar graph on the right). β-actin was used as an additional loading control. F. Representative photos and quantification (right) of lipid raft staining in thioglycolate-elicited peritoneal macrophages from Ldlr−/− and APOA1Tg; Ldlr−/− mice (n=7–13). G. BMDMs from female C57BL/6J mice were pre-treated with HDL (100 μg/ml) for 18 hr. The cells were then stimulated with LPS (10 ng/ml) in the absence of HDL for 4 hr, and inflammatory gene expression (Tnfa and Ifit2) was determined using qPCR (n=4–7). H. BMDMs from male C57BL/6J mice were pre-treated with HDL for 18 hr. The cells were then stimulated with LPS (10 ng/ml) in the absence of HDL for 4 hr to determine the phosphorylation status of p38 MAPK and STAT1 by immunoblot (n=4–5). Band intensities of p-p38 MAPK and p-STAT1 were normalized to those of total p38MAPK and STAT1, respectively, and quantified (bar graphs on the right). Data are shown as mean ± SEM. Tests for normality (Shapiro-Wilk) and equal variance (Brown-Forsythe) were performed for each of the data sets. P values were determined accordingly by Kruskal-Wallis followed by Dunn’s multiple comparison tests (A), one-way ANOVA followed by Tukey’s multiple comparison tests (C – Ifit2, D, E, H), Brown-Forsythe ANOVA followed by Dunnett’s multiple comparison tests (C - Mx1), two-way ANOVA followed by Sidak’s multiple comparison test (B, G), or unpaired two-tailed nonparametric Mann-Whitney test (F). Data are representative of at least three independent experiments performed in replicates.
