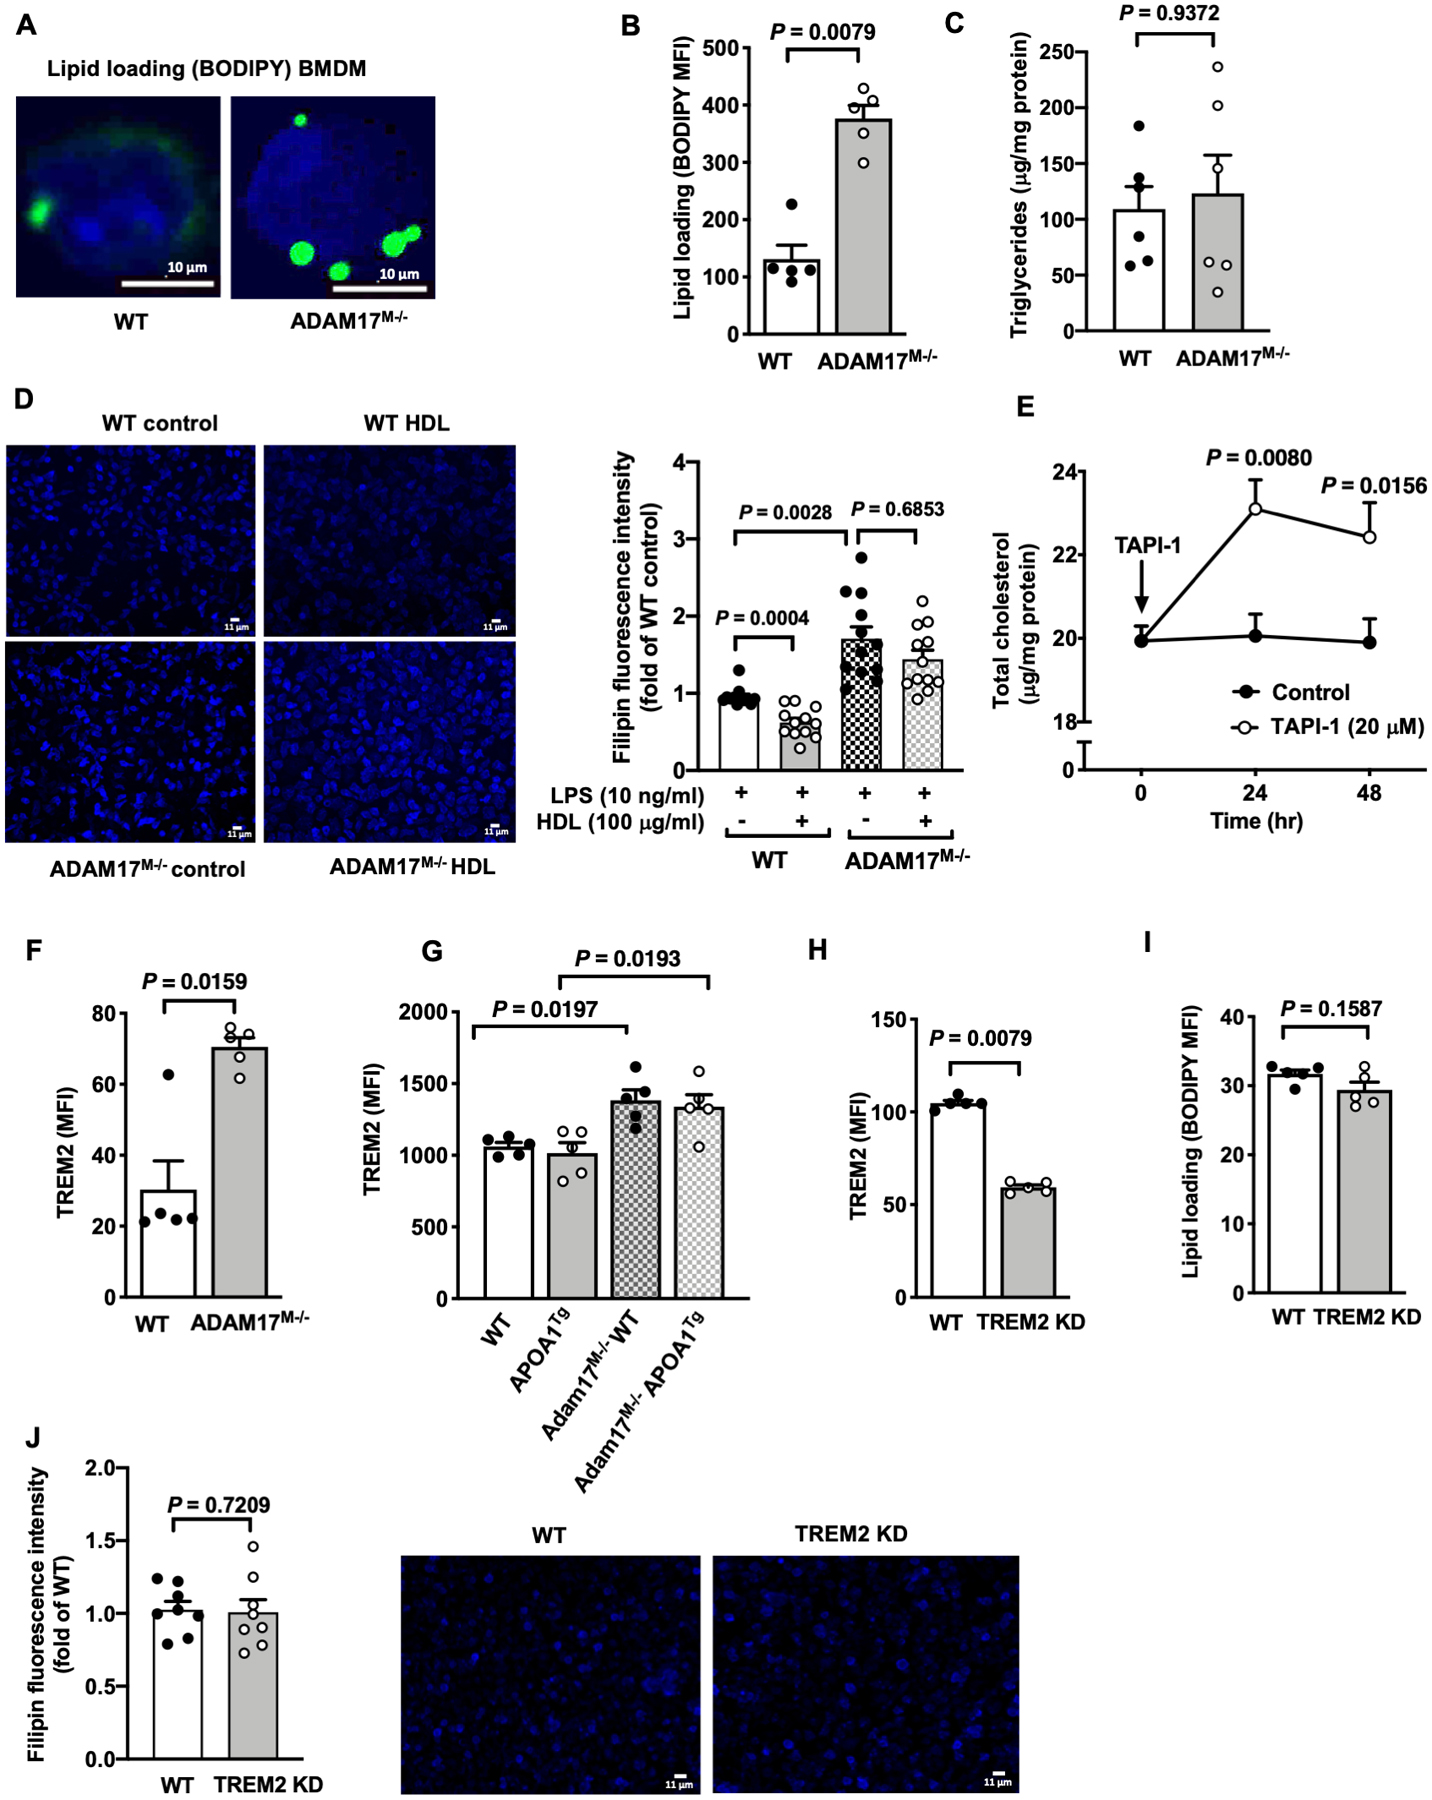
Figure 4. ADAM17-deficiency induces cholesterol loading and prevents HDL-mediated cholesterol depletion.

A. Representative images of neutral lipid staining with BODIPY® 493/503 (bright green) of BMDMs from male C57BL/6J WT and ADAM17-deficient mice (n=4). Representative cells are shown, the nuclei stained blue by DAPI. B. BMDMs from male WT and ADAM17-deficient mice were stained with BODIPY® 493/503 and mean fluorescent intensity (MFI) was determined by flow cytometry (n=5). C. Cellular triglyceride levels in BMDMs from male WT and ADAM17-deficient mice were analyzed (n=6). D. BMDMs from male WT and ADAM17-deficient mice were pre-treated with HDL (100 μg/ml). After 18 hr, free cholesterol was visualized by filipin staining (50 μg/ml), using fluorescence microscopy. Positive filipin staining was quantified as mean fluorescence intensity per cell and expressed as fold change of BMDMs from WT mice (n=12). E. BMDMs from female C57BL/6J mice were treated with TAPI-1 (20 μM) for indicated times. At the end of stimulation, the cells were used to analyze total cholesterol content (n=4–6). F. BMDMs from male WT and ADAM17M−/− mice were analyzed for cell surface expression of TREM2 by flow cytometry (n=5). G. Thioglycollate-elicited peritoneal macrophages from male Ldlr−/− or APOA1Tg; Ldlr−/− recipient mice transplanted with bone marrow from WT or ADAM17M−/− mice were stained for TREM2 and were analyzed by flow cytometry (n=5). H-J. TREM2 was knocked down (KD) in BMDM populations from male C57BL/6J mice by transfection of Cas9 complexed with Trem2-specific guide RNAs using lipofectamine 3000. 48 hr after transfection, cell surface expression of TREM2 (H) and (I) neutral lipid loading (BODIPY) were determined by flow cytometry. J. Free cholesterol was visualized by filipin (50 μg/ml) stain with fluorescence microscopy and quantified as mean fluorescence intensity in control and Trem2 KD BMDMs (n=8; experiment performed twice with similar results). Data are shown as mean ± SEM. Tests for normality (Shapiro-Wilk) and equal variance (Brown-Forsythe) were performed for each of the data sets. P values were determined accordingly by two-tailed Mann-Whitney test (B, C, F, H, I, J), Brown-Forsythe ANOVA followed by Dunnett’s multiple comparisons tests (D), or two-way ANOVA and Sidak’s multiple comparison tests (E). Unless otherwise stated, data are representative of at least three independent experiments performed in replicates in BMDMs from male mice.
