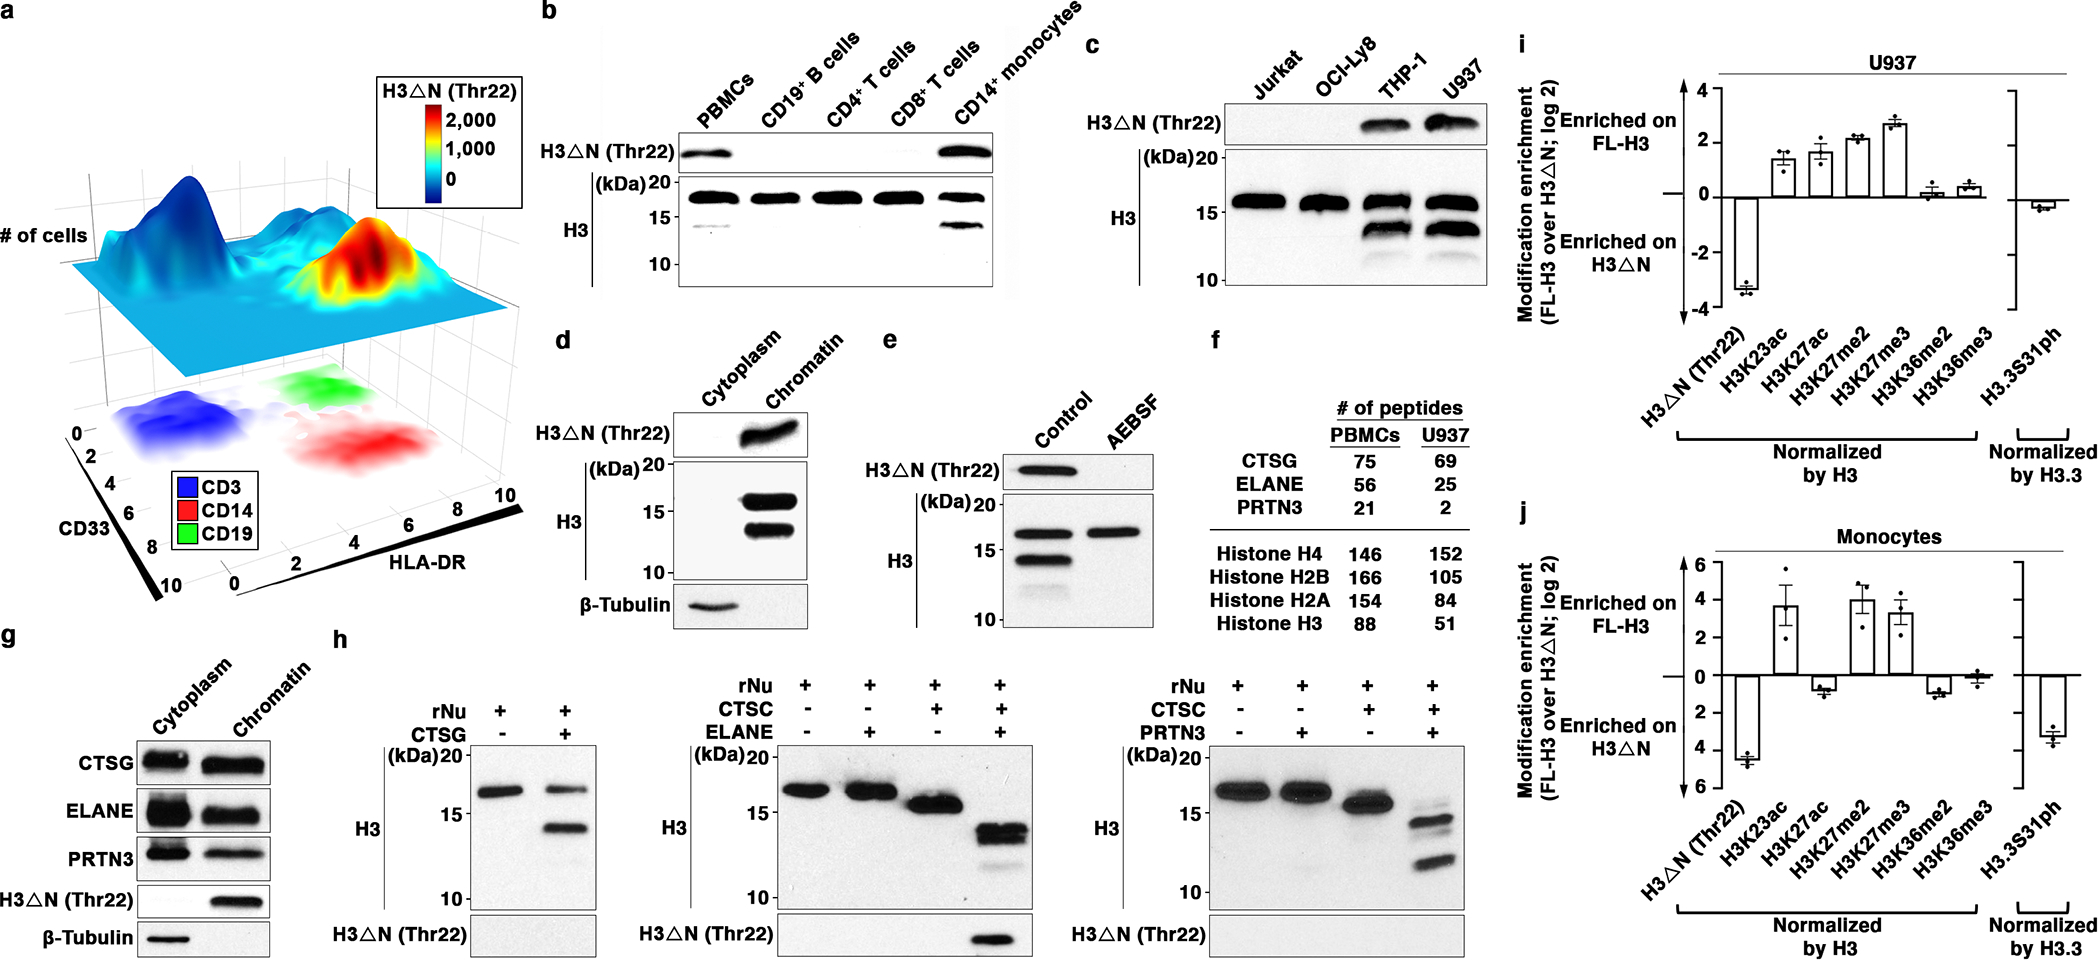
Fig. 1. CTSG, ELANE, and PRTN3 Catalyze H3ΔN in Monocytes.

(a) H3ΔNThr22 distinguishes CD14+ monocytes. EpiTOF analysis of PBMCs from 20 healthy volunteers as described previously12. X- and y-axes, HLA-DR and CD33 levels, respectively. Top plane: color, normalized H3ΔNThr22 level; height, cell count. Bottom plane: color, CD3 (blue), CD14 (red) and CD19 (green) levels.
(b) Monocyte-specific H3ΔN enrichment relative to lymphocytes. Western blot analysis of whole cell extract (WCE) from purified primary human immune cells.
(c) Monocytic cell lines retain high H3ΔN levels in comparison with other cell lines of lymphoid origins. Western blot analysis of WCE from the indicated cell lines.
(d) H3ΔN native chromatin incorporation. Western blot analysis of U937 cells biochemically separated into cytoplasmic and chromatin fractions.
(e) Serine protease-mediated H3ΔN. Western blot analysis of WCE from AEBSF-treated U937 cells. Control, PBS-treated.
(f and g) Chromatin localization of CTSG, ELANE, and PRTN3. Protein identification of purified chromatin from PBMCs (left) or U937 cells (right) using mass spectrometry. The numbers of peptides mapped to the indicated histone proteins and serine proteases are shown (f). Western blot analysis of cytoplasmic and chromatin fractions purified from U937 cells (g). Molecular weight markers, see Source Data.
(h) CTSG, ELANE, and PRTN3 catalyze controlled H3 proteolytic cleavage in vitro. Immunoblotting analysis of protease assays using recombinant CTSG (left), ELANE (middle), or PRTN3 (right) and recombinant nucleosomes as substrate. ELANE and PRTN3 activities require pre-activation by CTSC51.
(i and j) Differential histone modifications between FL- and truncated H3. Quantification of the indicated histone marks between FL-H3 and H3ΔN in U937 cells (i) or primary monocytes (j). Y-axis, FL-H3-over-H3ΔN ratio of the indicated histone marks normalized against the ratio of H3 or H3.3 (for H3.3S31ph). Data represent mean ± S.E.M. (three biological replicates).
