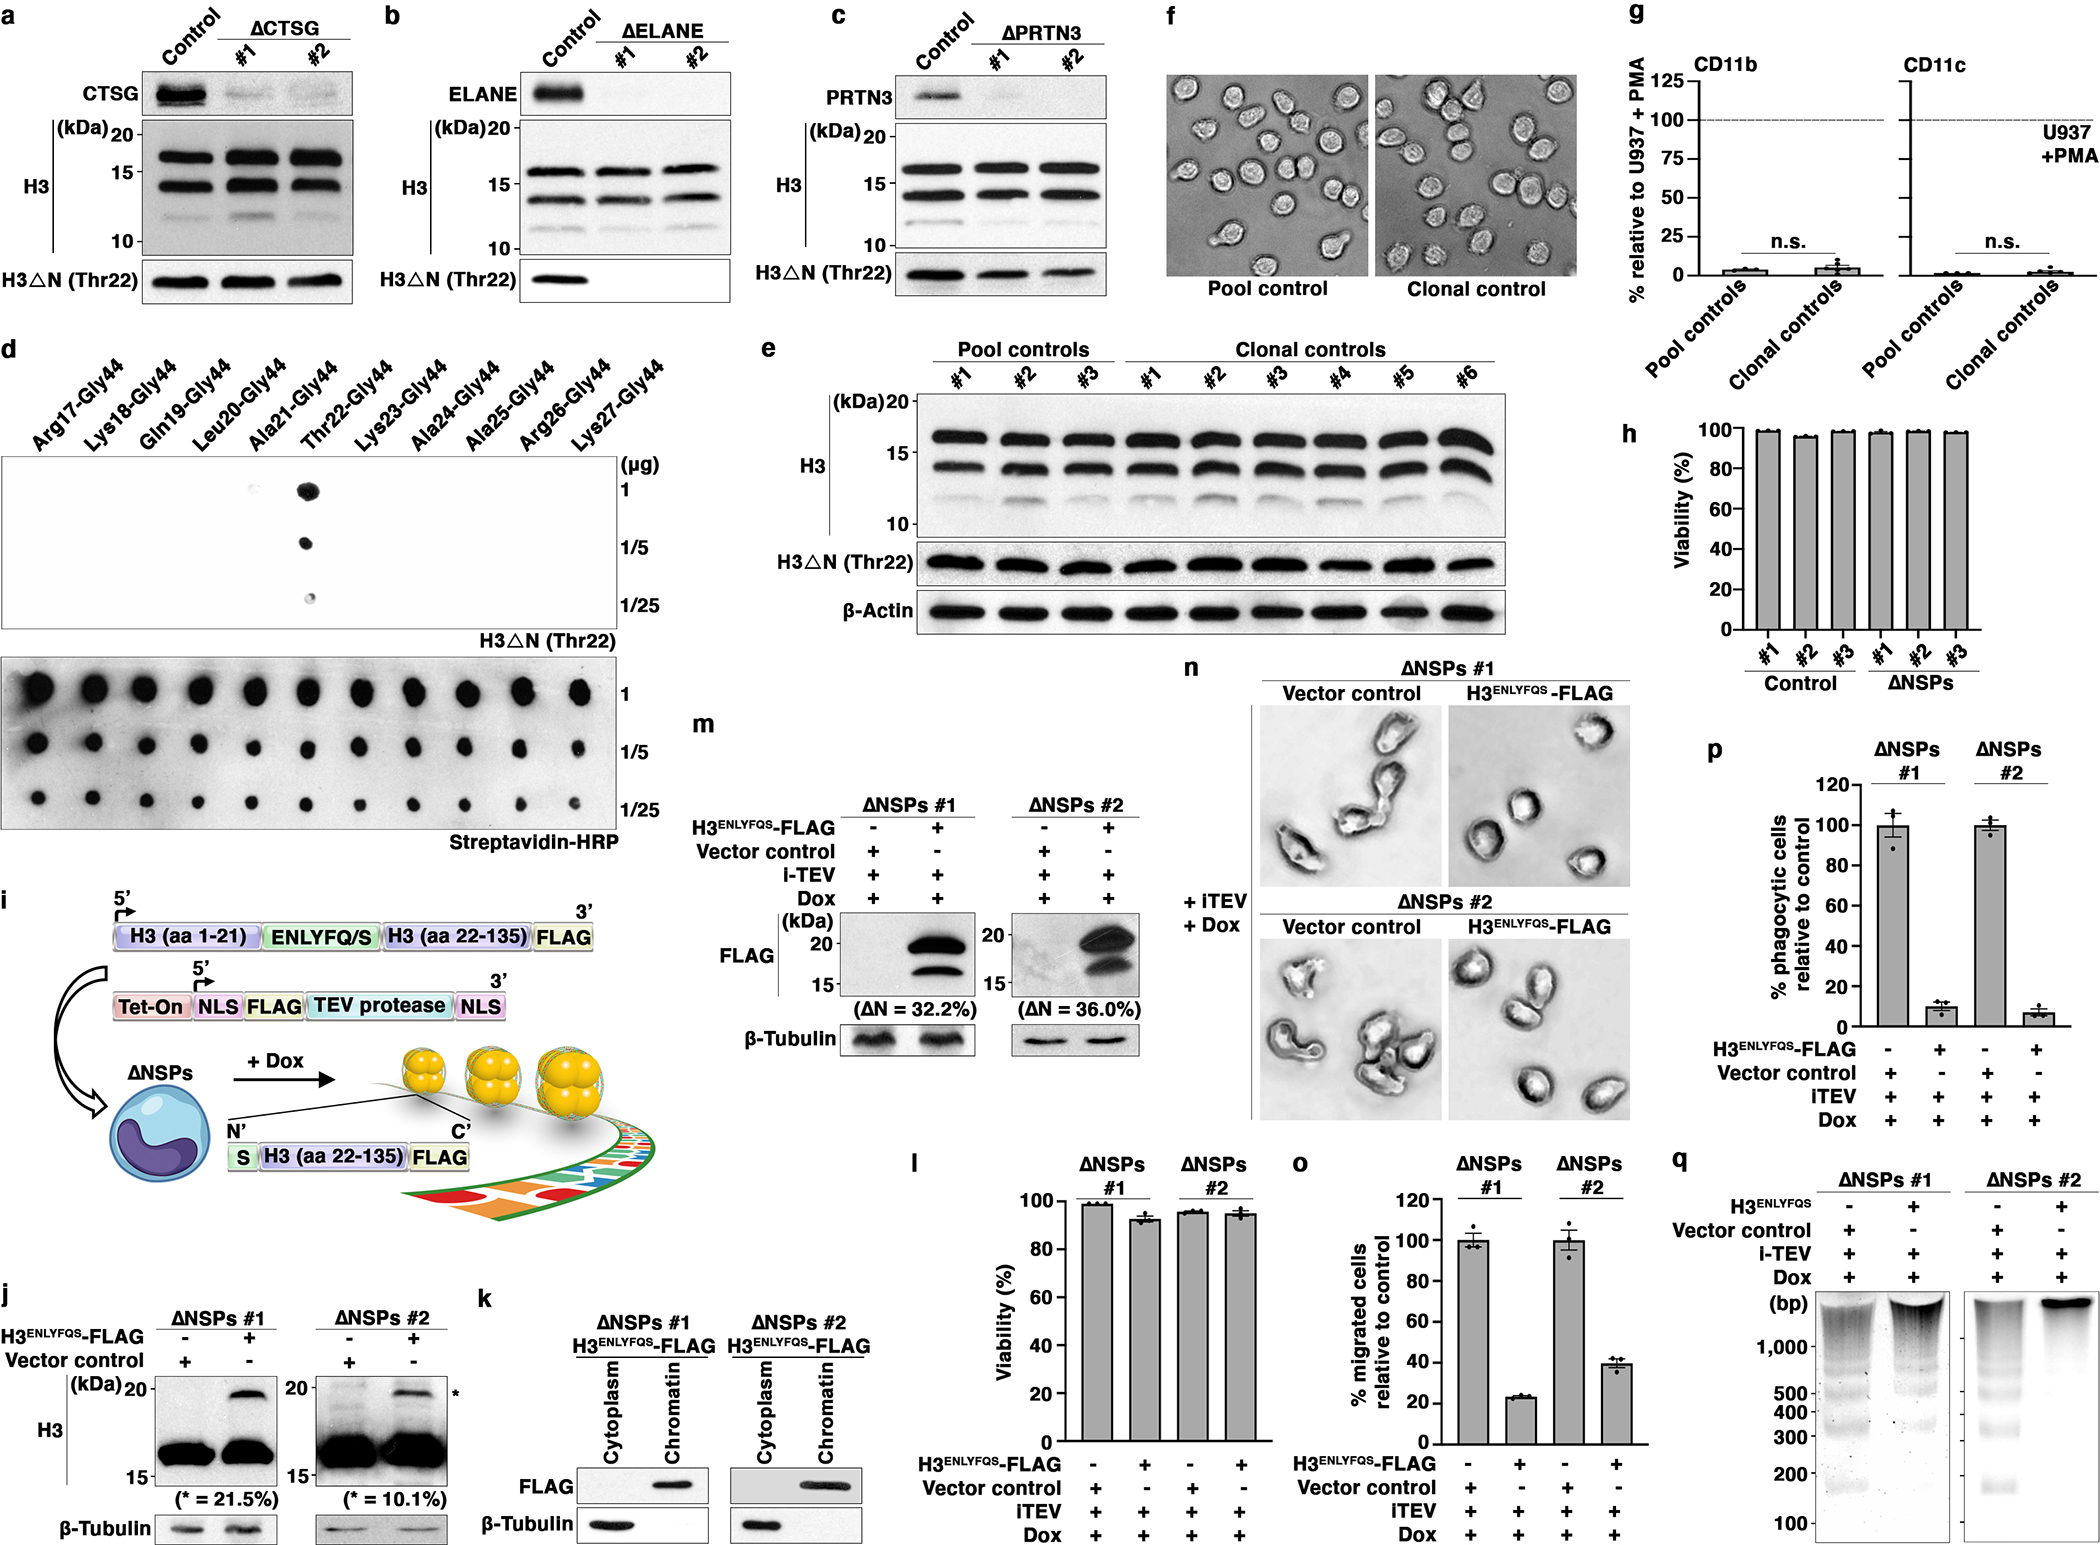
Extended Data Fig. 2. Reintroduction of H3ΔN into ΔNSPs Cells Reverses the Morphologic and Functional Alterations Associated with NSP Depletion.

(a, b, c) Depletion of individual NSPs does not affect global H3ΔN level in monocytes. Western blot analysis of WCE from U937 cells depleted of CTSG (a), ELANE (b), or PRTN3 (c). Control cells express CRISPR-Cas9 but lack sgRNA.
(d) Highly specific anti-H3ΔNThr22 antibody used in this study. Dot blot analysis of the anti-H3ΔNThr22 antibody using the indicated synthetic peptides. This affinity reagent is employed throughout the entire study.
(e, f, g) Clonal selection by FACS does not alter H3ΔN level and pattern, cell morphology, or activation markers CD11b and CD11c expression. Western analysis of WCE from control cells as in Fig. 2a with (six samples on the right) or without (three samples on the left) clonal selection by FACS (e). Representative light microscopy images of the control cells as in (e) (f). Mass cytometry analysis of the cells as in (e) (g). Y-axis, mean signal intensities of CD11b (left) or CD11c (right) from the indicated cells relative to the signals from PMA-activated U937 cells as a positive control. Data represent mean ± S.E.M. (three pool controls (left) or six clonal controls (right)). Clonal controls are randomly selected from approximately 400 sorted clones. Statistical significance is determined by two-tailed Student’s t-test.
(h) Simultaneous NSP depletion does not affect cell viability. Mass cytometry analysis of ΔNSPs and control cells. The percentage of cells negative for cisplatin staining for each cell line is shown. Data represent mean ± S.E.M. (three technical replicates).
(i) Strategy to reintroduce H3ΔN into ΔNSPs cells.
(j) Expression of epitope-tagged exogenous H3 (H3ENLYFQS-FLAG) in ΔNSPs cells. Western blot analysis of WCE from ΔNSPs cells transduced with H3ENLYFQS-FLAG (right lane) or empty vector (left lane). The relative abundance of H3ENLYFQS-FLAG to endogenous H3 determined by ImageJ software is shown.
(k) Chromatin localization of exogenous H3. Western blot analysis of cytoplasmic and chromatin fractions from ΔNSPs cells expressing H3ENLYFQS-FLAG.
(l) Doxycycline treatment to induce TEV protease expression and H3ENLYFQS-FLAG cleavage does not affect cell viability. Viability of the indicated cells is determined by trypan blue staining and an automatic cell counter. Data represent mean ± S.E.M. (three technical replicates).
(m) H3ENLYFQS-FLAG cleavage in response to doxycycline-induced TEV protease expression. Western analysis of WCE from the indicated cells. The abundance of cleavage product relative to total H3ENLYFQS-FLAG is determined by ImageJ software.
(n, o, p) Reintroduction of H3ΔN into ΔNSPs cells reverses morphological and functional alterations associated with NSP depletion. Light microscopy (n), transwell cell migration (o), and phagocytosis (p) analyses of the cells as in (m). Data represent mean ± S.E.M. (three technical replicates).
(q) Reintroduction of H3ΔN into ΔNSPs cells alters global chromatin architecture. MNase sensitivity analysis of the cells as in (m).
