
Fig. 3. NSP and H3ΔN Repression During Monocyte-to-Macrophage Differentiation.
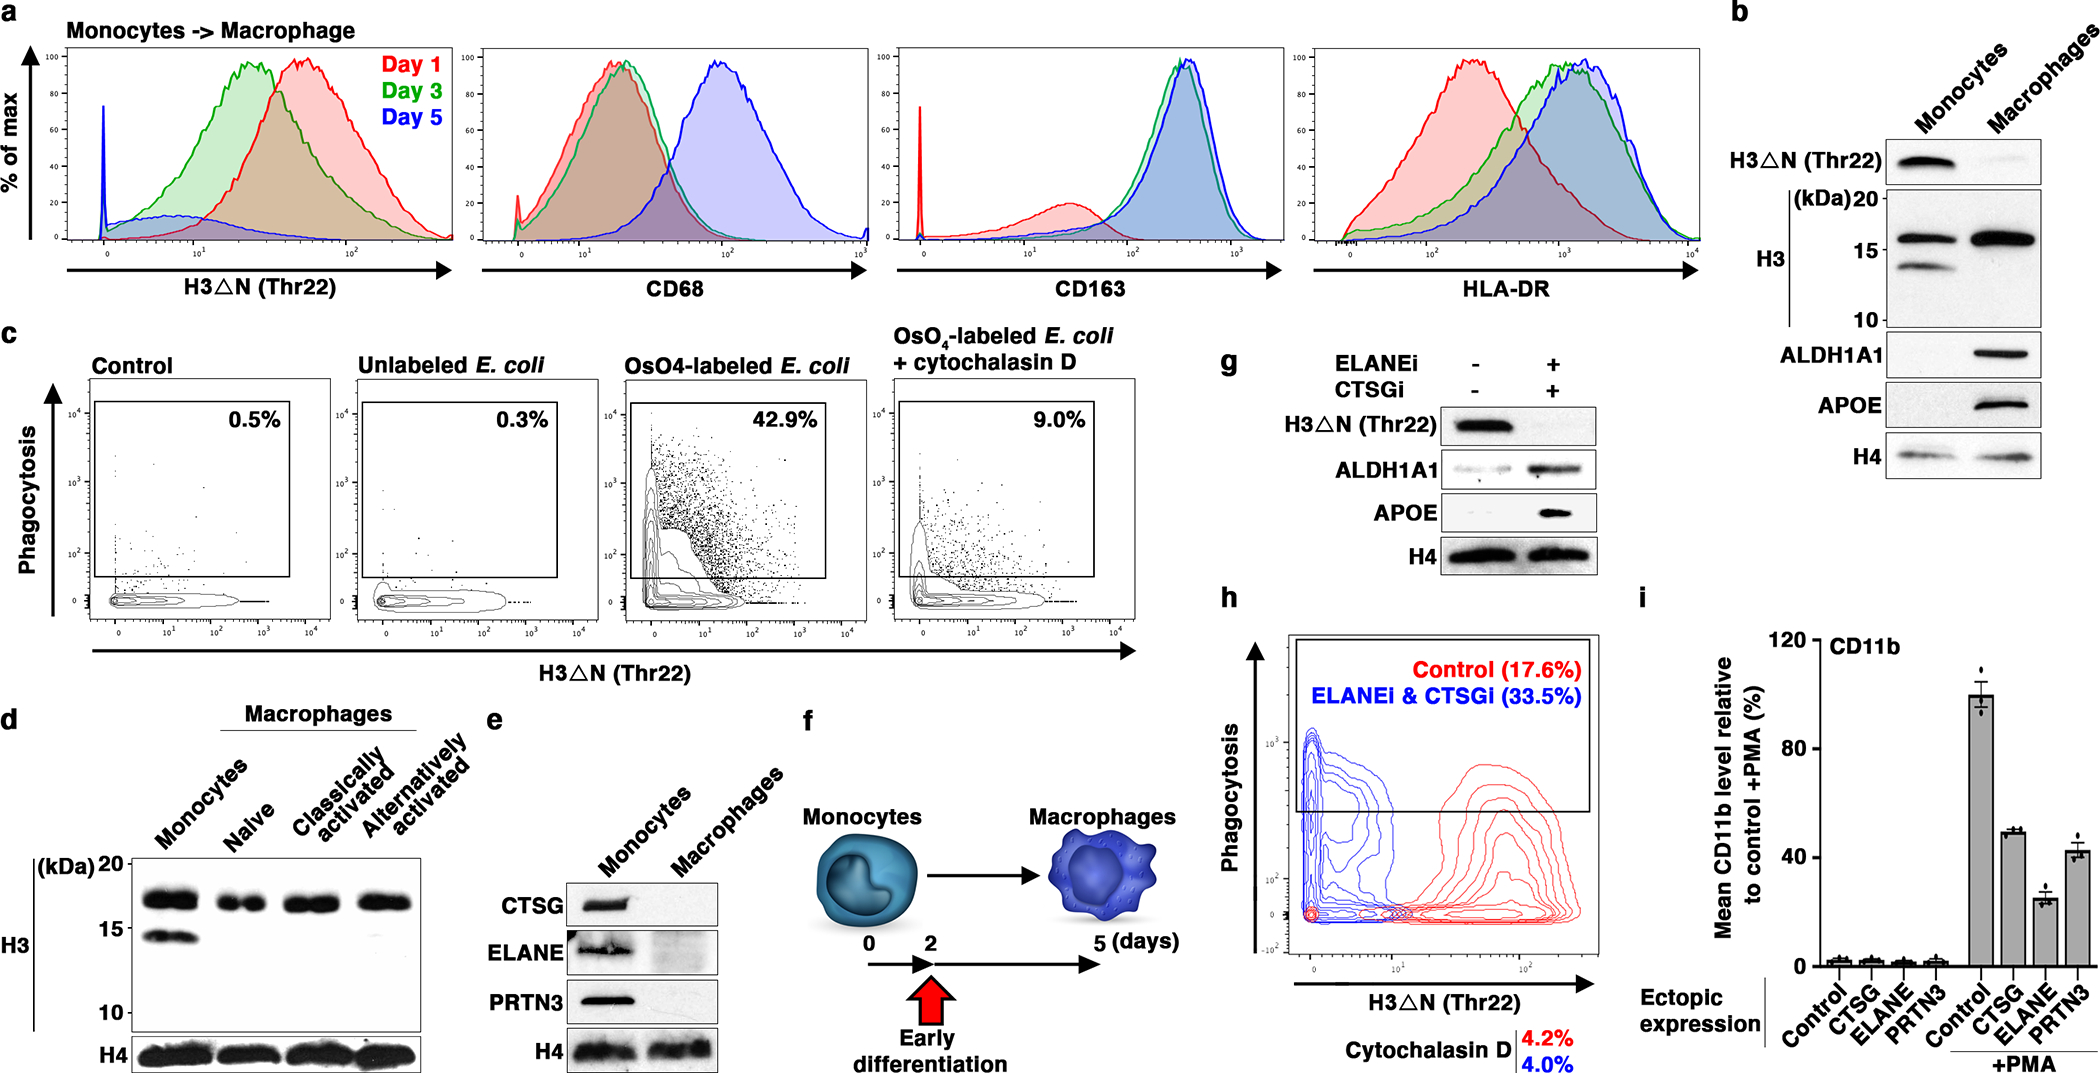
(a and b) H3ΔN repression as monocytes differentiate into macrophages. Mass cytometry (a) and western blot (b) analyses of primary monocytes and the matching monocyte-derived macrophages. Cells collected at days one (red), three (green), and five (blue) are analyzed by mass cytometry (a). Day one and seven samples are subject to immunoblotting analysis (b). Molecular weight markers, see Source Data.
(c) Increased phagocytosis capability of differentiating monocytes with repressed H3ΔN. Mass cytometry analysis of cells as in (a) (day five) incubated with osmium-labelled E. coli to assess phagocytosis capability22. Control, no E coli particle is added; cytochalasin D, control to show the specificity of phagocytosis measurement. H3ΔNThr22 (x-axis) and osmium (y-axis) levels measured by mass cytometry are shown.
(d) H3ΔN repression is maintained in polarized macrophages. Western blot analysis of peripheral blood monocytes, naïve macrophages generated as in (b), classically activated macrophages polarized by LPS and IFN-γ, and alternatively activated macrophages polarized by IL-4.
(e) CTSG, ELANE, and PRTN3 repression during monocyte-to-macrophage differentiation. Western blot analysis of the samples as in (b) using the indicated antibodies. Molecular weight markers, see Source Data.
(f-h) Accelerated macrophage development by pharmacological inhibition of NSPs. Overview of the chronological timeline for this experiment (f). Western blot analysis of WCE from peripheral blood monocytes cultured in the presence or absence of ELANE inhibitor GW311616 in combination with CTSG inhibitor CAS 429676–93-7 for two days (g). Molecular weight markers, see Source Data. Phagocytosis analysis of the cells as in (g) using mass cytometry and osmium-labeled E. coli (h).
(i) Constitutive NSP expression suppresses monocytic cell differentiation. U937 cells stably expressing the indicated NSPs (x-axis) under the control of cytomegalovirus promoter are induced for differentiation by PMA. CD11b expression is determined by mass cytometry. Data represent mean ± S.E.M. (three technical replicates).