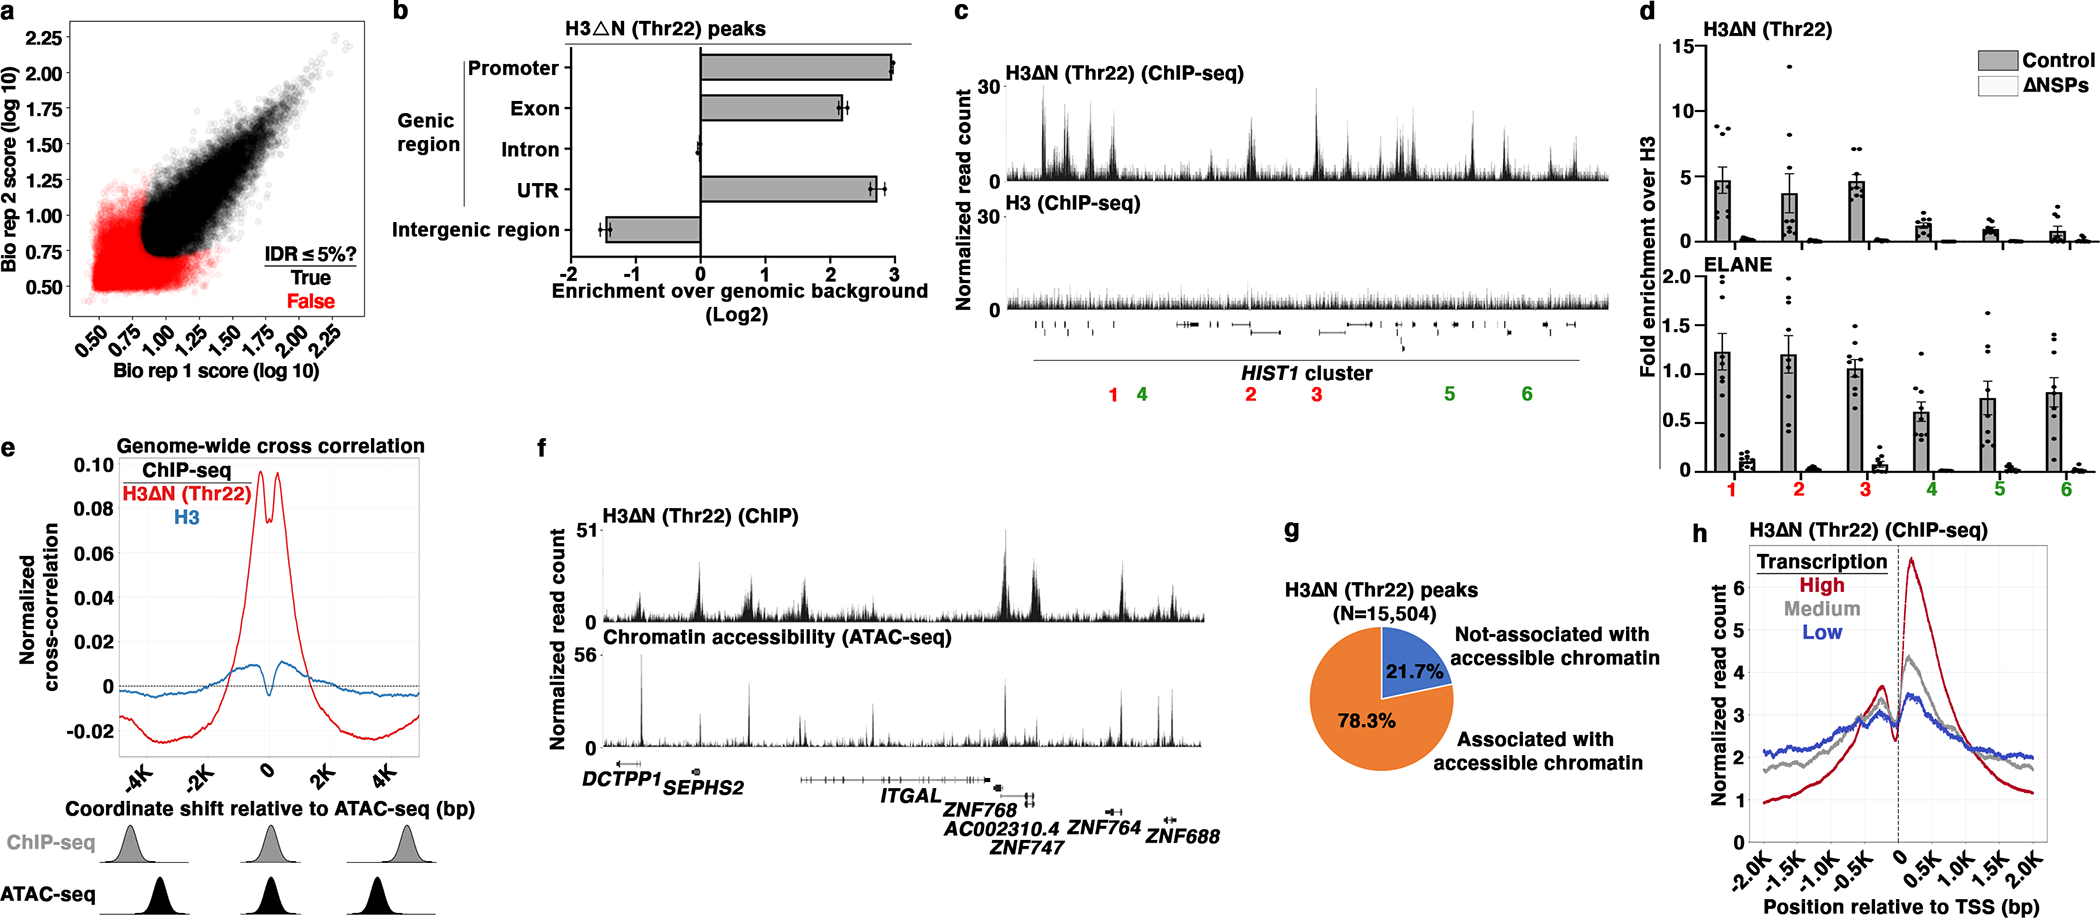
Fig. 4. Widespread H3ΔN Genomic Distribution and Its Permissive Chromatin Association in Monocytic Cells.

(a) Identification of H3ΔNThr22-enriched peaks in wild-type U937 cells. Scaled signal intensities of H3ΔNThr22 ChIP-seq peaks in biological replicate one (x-axis) and two (y-axis). Peaks that pass 5% IDR24 threshold are labeled (black). Red, peaks with IDR > 5%.
(b) Genic region enrichment of H3ΔNThr22. X-axis, the enrichment of H3ΔNThr22 peaks in the indicated genomic regions. Center line, genomic distribution with no enrichment. Data represent mean ± S.D. (two biological replicates).
(c and d) H3ΔNThr22 enrichment and ELANE occupancy at the HIST1 locus. Representative genomic tracks of H3ΔNThr22 (top) and bulk H3 (bottom) ChIP-seq data. Regions with high (red) or low (green) H3ΔNThr22 are tested (c). qPCR analysis of H3ΔNThr22 (top) or ELANE (bottom) ChIP DNA from control (gray) or ΔNSPs (white) cells using the indicated primer pairs. Y-axes, fold enrichment over signals from bulk H3. Data represent mean ± S.E.M. (three biological replicates (three control cell lines or three ΔNSPs clones) with three technical replicates (N=9)) (d).
(e) Association between H3ΔNThr22 enrichment and permissive chromatin at the nucleotide level. Cross correlation analysis that overlays the H3ΔNThr22 (red) or bulk H3 (blue) ChIP-seq datasets over the ATAC-seq dataset. Aggregate data from 1,000 randomly selected start points are shown. Correlations are computed as the ChIP-seq datasets are shifted with a distance in base pair depicted at the x-axis relative to the ATAC-seq dataset. Y-axis, normalized correlation score.
(f and g) Association between H3ΔNThr22 enrichment and permissive chromatin at the peak level. Representative genomic tracks of H3ΔNThr22 ChIP-seq (top) and ATAC-seq (bottom) datasets (f). Pie chart depicts the percentage of H3ΔNThr22 ChIP-seq peaks that are associated with ATAC-seq peaks (g).
(h) Association between H3ΔNThr22 enrichment and active transcription. H3ΔNThr22 levels at the TSS-proximal regions of genes with high (red), medium (gray), or low (blue) transcription activities (GSE10756625). X-axis, base pair relative to TSS; y-axis, H3ΔNThr22 ChIP-seq signal intensity.
