
Fig. 5. Permissive Chromatin and Active Transcription Association of H3ΔN in Primary Monocytes.
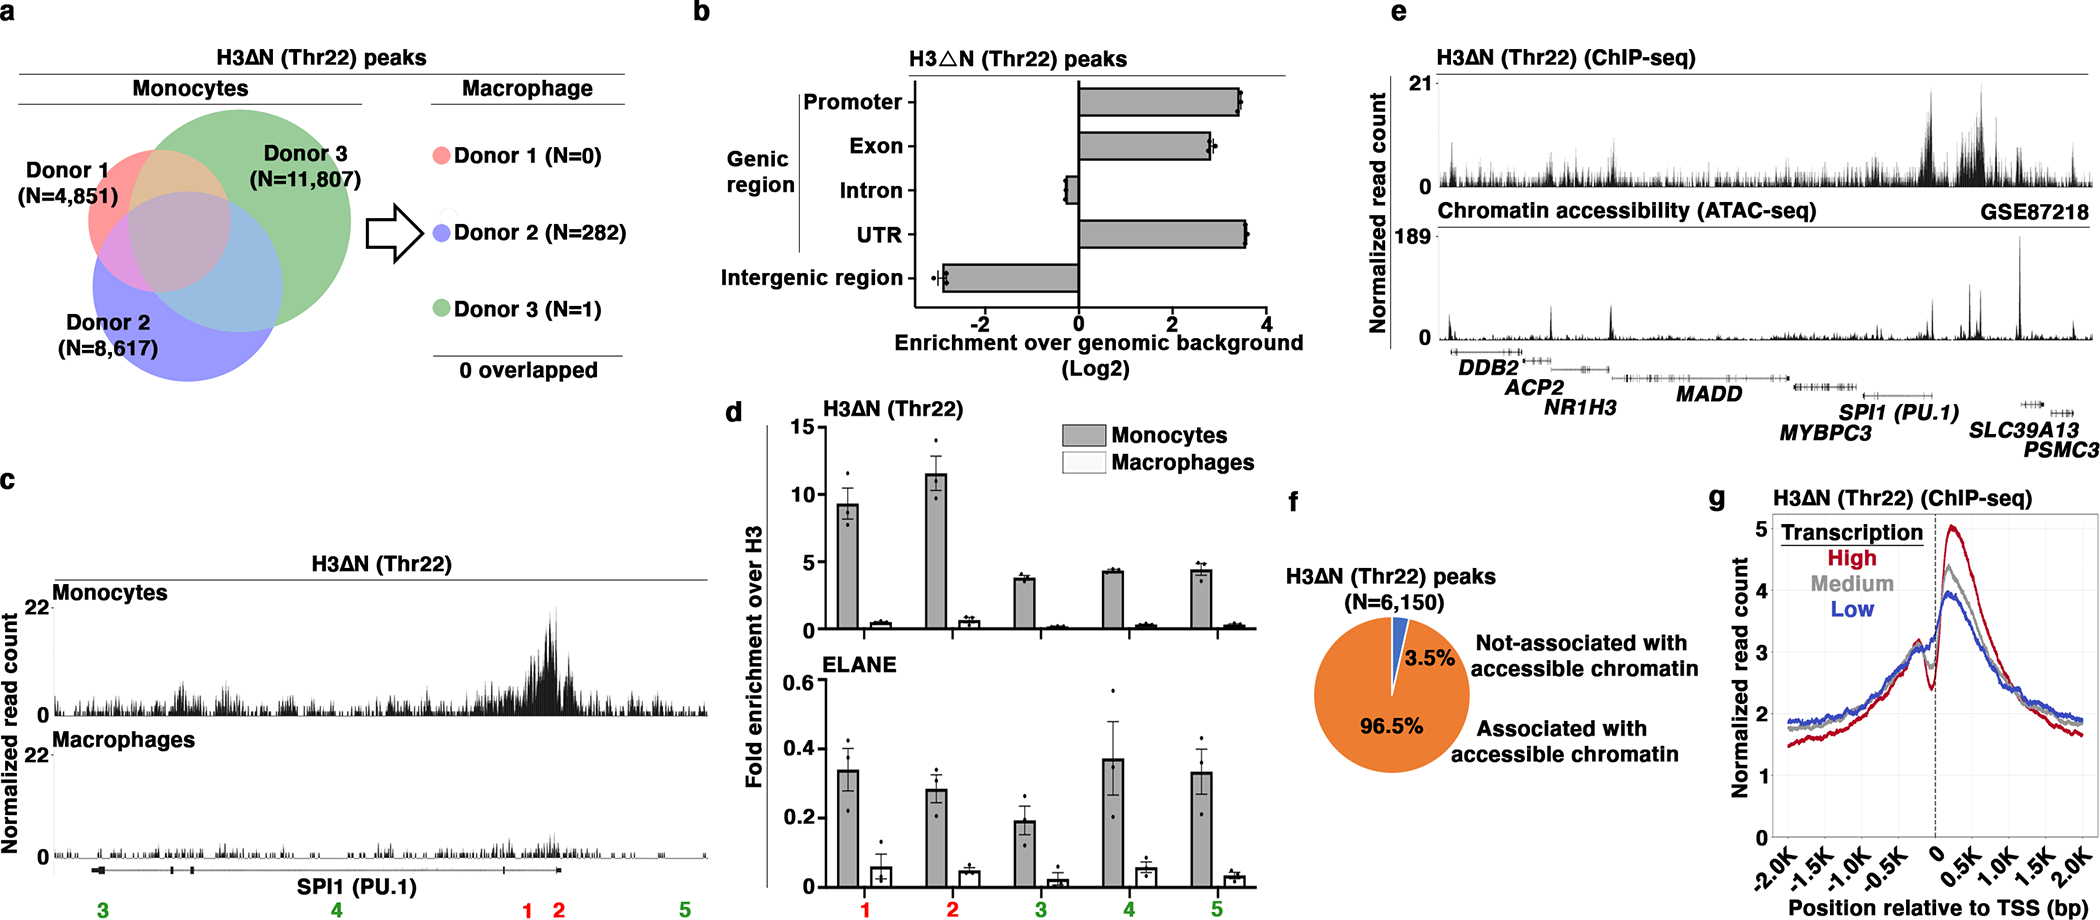
(a) Identification of H3ΔNThr22-enriched peaks in primary monocytes and paired monocyte-derived macrophages. Venn diagram depicts the number of H3ΔNThr22-enriched peaks in monocytes (left). The numbers of peaks identified in macrophages from the same donors are shown (right).
(b) Genic region enrichment of H3ΔNThr22 in primary monocytes. X-axis, H3ΔNThr22 peak enrichment in the indicated genomic regions. Center line, genomic distribution with no enrichment. Data represent mean ± S.D. (three biological replicates).
(c and d) H3ΔNThr22 enrichment and ELANE occupancy at the PU.1 (SPI1) locus in primary monocytes. Representative genomic tracks of H3ΔNThr22 ChIP-seq data from primary monocytes (top) or macrophages (bottom) (c). Genomic regions with high (red) or low (green) H3ΔNThr22 ChIP-seq signals are tested. qPCR analysis of H3ΔNThr22 enrichment (top) or ELANE occupancy (bottom) in primary monocytes (gray) or in the matching monocyte-derived macrophages (white) using the indicated primer pairs. Y-axes, fold enrichment over bulk H3. Data represent mean ± S.E.M. (three technical replicates) (d).
(e and f) Association between H3ΔNThr22 enrichment and permissive chromatin at the peak level in primary monocytes. Representative genomic tracks of H3ΔNThr22 ChIP-seq (top) and ATAC-seq (GSE8721827) (bottom) datasets from primary monocytes (e). Pie chart depicts the percentage of H3ΔNThr22 ChIP-seq peaks that are associated with ATAC-seq peaks (f).
(g) Association between H3ΔNThr22 enrichment and active transcription in primary monocytes. H3ΔNThr22 levels at the TSS-proximal regions for genes with high (red), medium (gray), or low (blue) transcription activities (GSE509919).