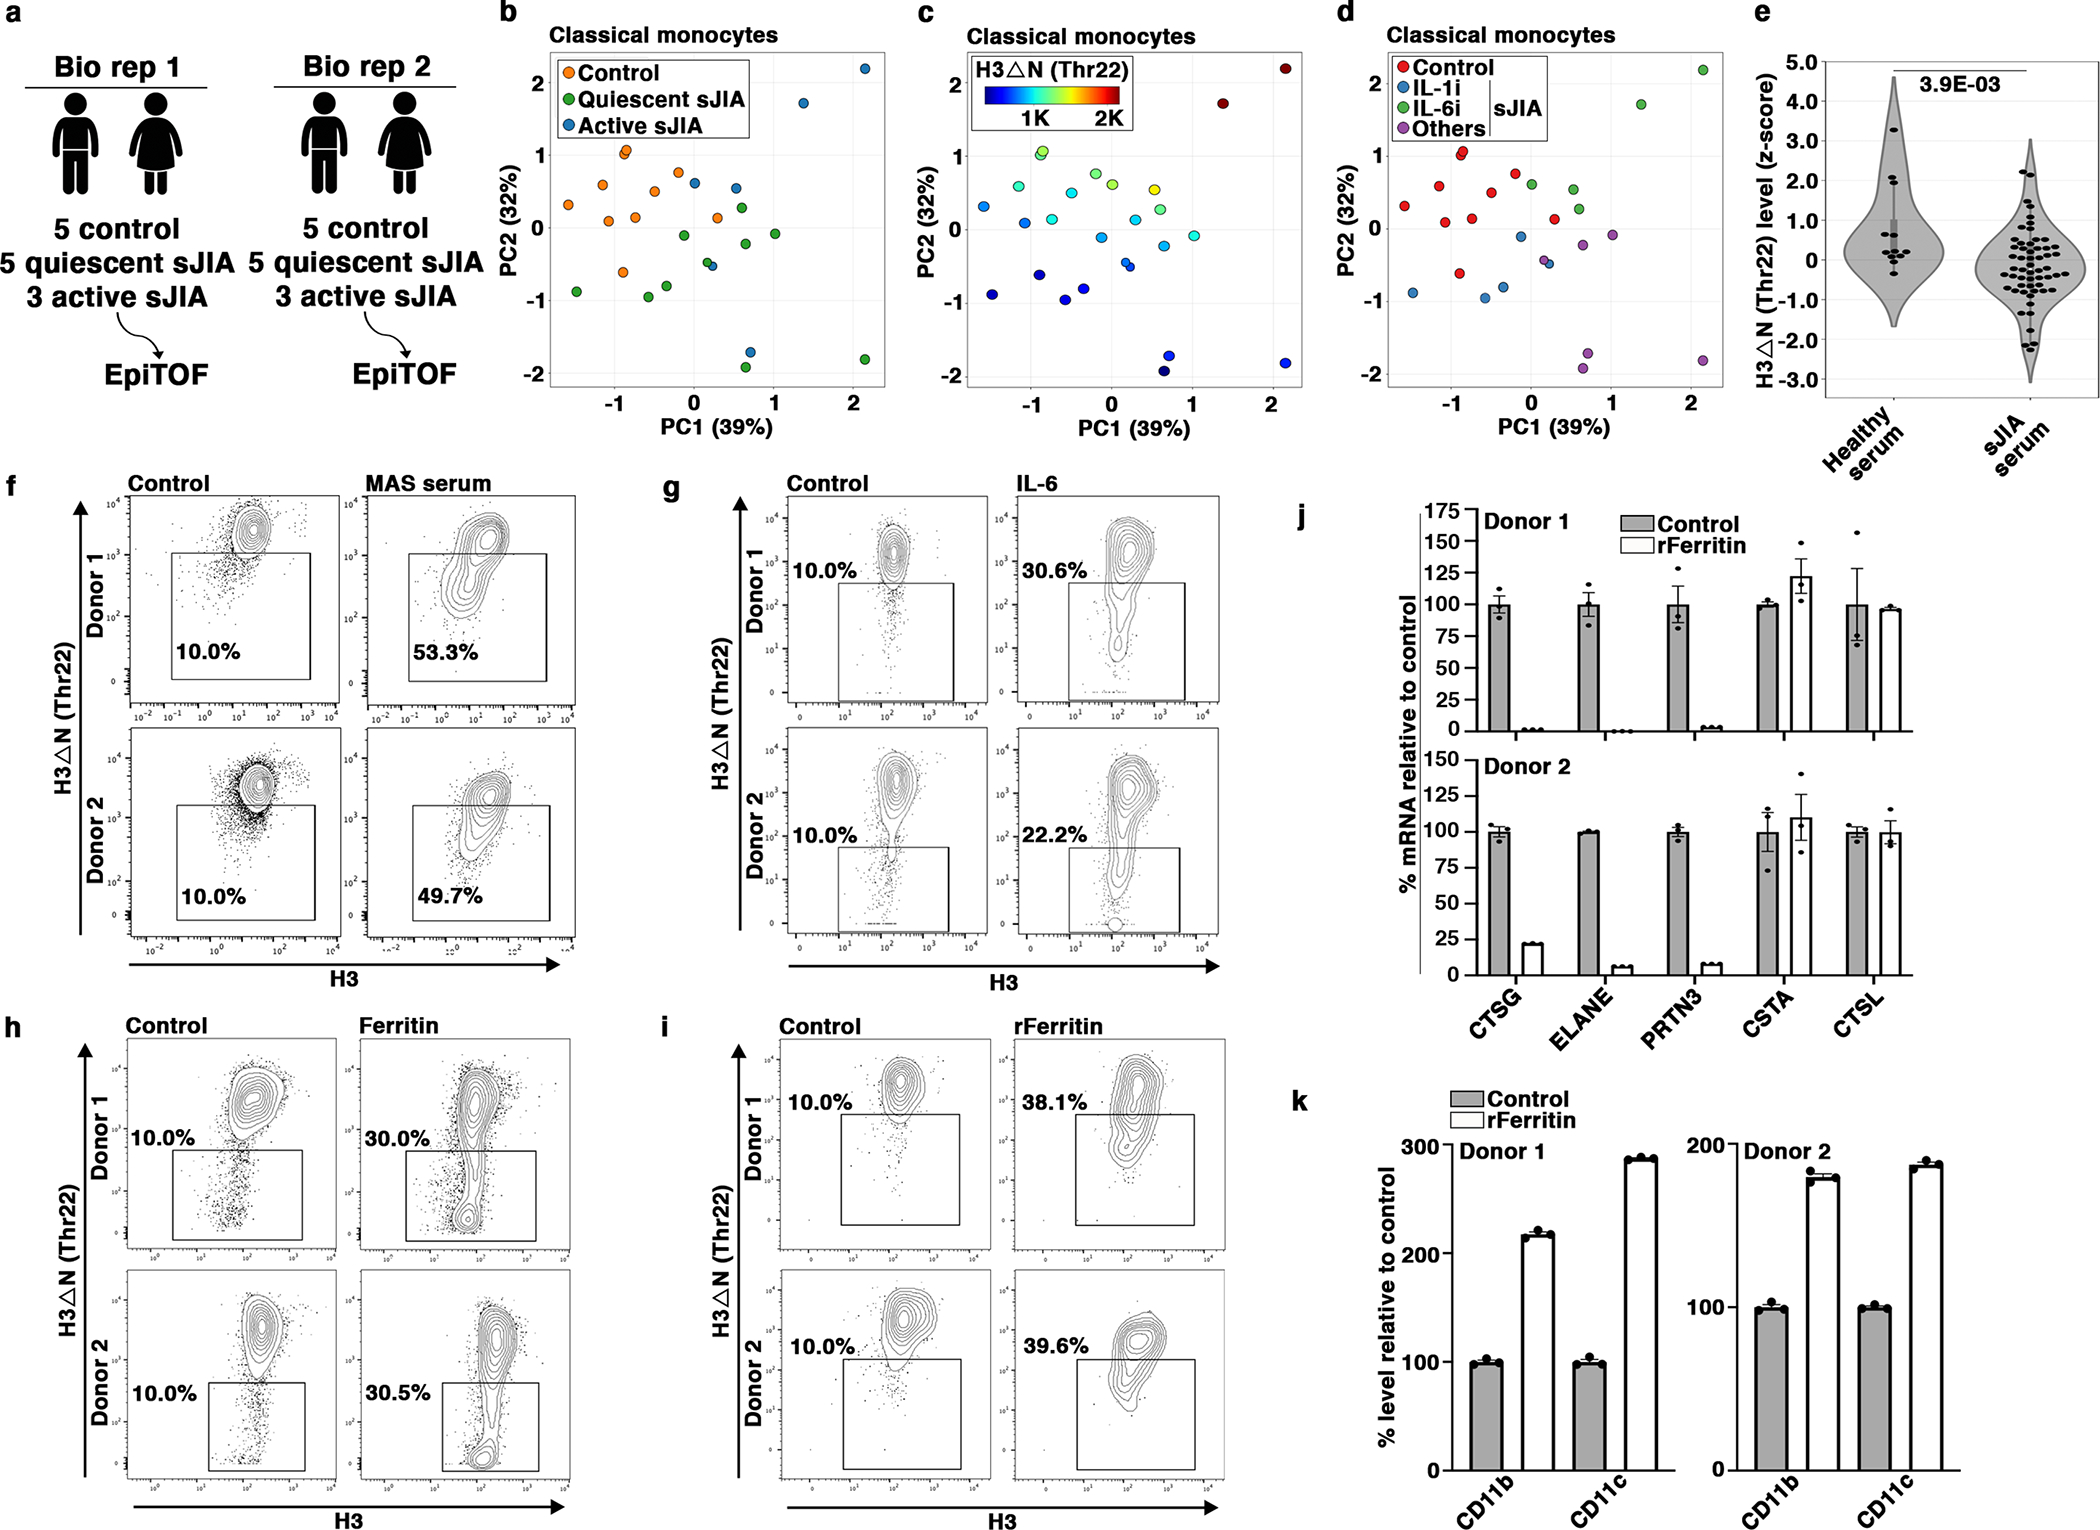
Fig. 8. Repressed H3ΔN in sJIA Patients.

(a) EpiTOF analysis.
(b) Separation of monocytes from sJIA patients or from healthy volunteers by histone modification profiles. PCA of EpiTOF data. Each dot, monocyte from a sJIA patient; green, quiescent disease; blue, active disease; orange, healthy volunteer; %, the fraction of variance explained by each principal component.
(c) Reduced H3ΔN in monocytes from patients with sJIA. PCA as in (b). Color, H3ΔNThr22 level.
(d) sJIA patients receiving IL-6 blockade therapy do not show reduced H3ΔNThr22 in monocytes. PCA as in (b). Blue, biologics targeting IL-1; green, biologics targeting IL-6; purple, others (see Results).
(e) Sera from sJIA patients induce H3ΔN repression in monocytes from healthy volunteers. Mass cytometry analysis of H3ΔNThr22 levels in monocytes cultured in the presence of sera from 14 sJIA patients (right, 56 data points) or 3 healthy donors (left, 12 data points) for 24 hours. Statistical significance is determined by mixed effect linear model with P value depicted.
(f) Sera from sJIA patients with MAS induce marked H3ΔN reduction. Mass cytometry analysis of monocytes from two healthy donors (top and bottom) cultured in the presence of sera from a healthy donor (left) or a sJIA patient with MAS (right) for 24 hours. X-axis, bulk H3 level; y-axis, H3ΔNThr22 level.
(g) IL-6 induces H3ΔN reduction. In vitro stimulation assay as in (f) using IL-6.
(h) Native ferritin induces H3ΔNThr22 repression in monocytes. In vitro stimulation assay as in (f) using native ferritin.
(i) Recombinant ferritin induces H3ΔNThr22 repression in monocytes. In vitro stimulation assay as in (f) using recombinant ferritin.
(j) Ferritin treatment suppresses NSP expression. qPCR analysis of the indicated genes (x-axis). White, with recombinant ferritin; gray, without recombinant ferritin; y-axis, expression relative to that in control cells; top, donor 1; bottom, donor 2. Data represent mean ± S.E.M. (three technical replicates).
(k) Ferritin promotes monocyte-to-macrophage differentiation. Mass cytometry analysis. White, with recombinant ferritin; gray, without recombinant ferritin. CD11b (left) and CD11c (right) expression is analyzed. Top, donor 1; bottom, donor 2; y-axis, expression relative to control. Data represent mean ± S.E.M. (three technical replicates).
