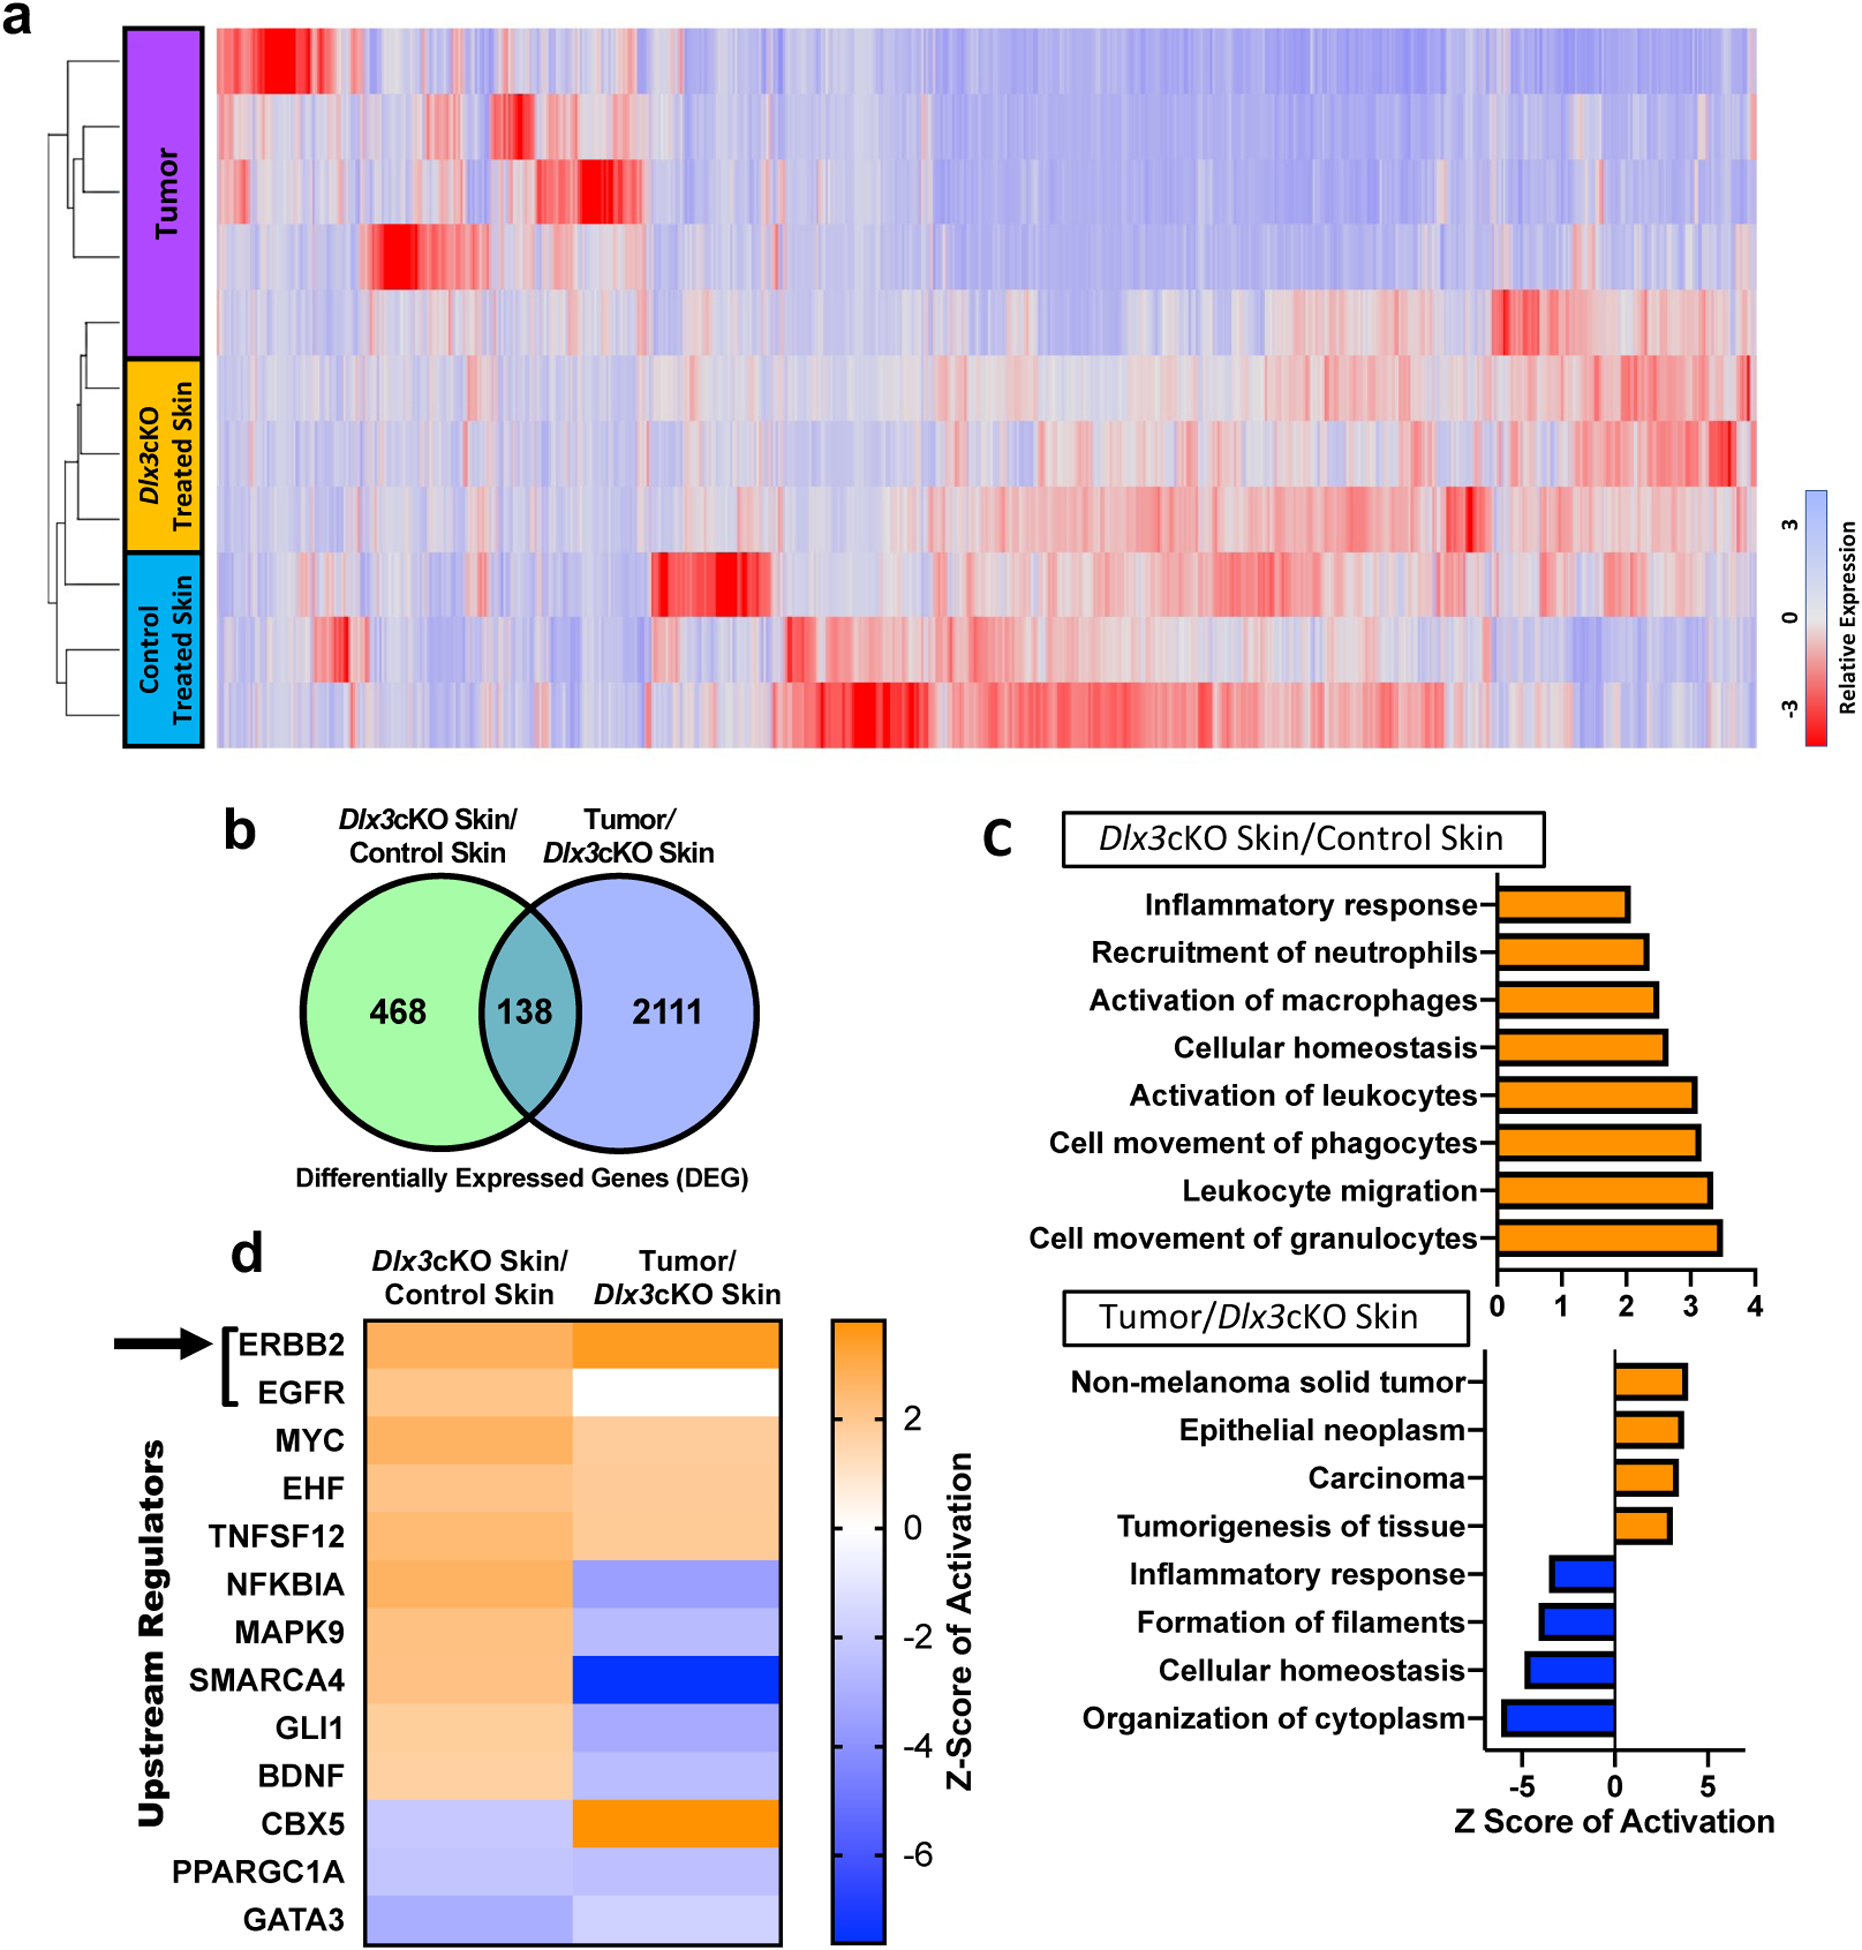
Figure 6. Gene expression profiling of mouse skin and tumor samples from DMBA-only skin carcinogenesis.

(a) A cluster diagram of RNA-seq data from five tumors and, skin tissues from three treated control and Dlx3cKO mice, respectively. The color bars represent relative expression levels: blue indicates higher than average expression and red indicates lower than average expression. (b) Venn diagram of RNA-seq analysis of two comparisons: Dlx3cKO treated skin vs control treated skin and Tumor vs Dlx3cKO treated skin. (c) Top enriched GO processes from commonly regulated genes in Dlx3cKO treated skin vs control treated skin and Tumor vs Dlx3cKO treated skin demonstrates processes involved in inflammation and carcinogenesis to be deregulated in DLX3cKO skin and tumors, respectively. (d) Ingenuity pathway software analysis identifies statistically significant upstream regulators for the cluster of genes showed in panel. ERBB2 and EGFR are the two topmost significantly upregulated upstream regulators in both the Dlx3cKO skin and tumor (indicated by black arrow).
