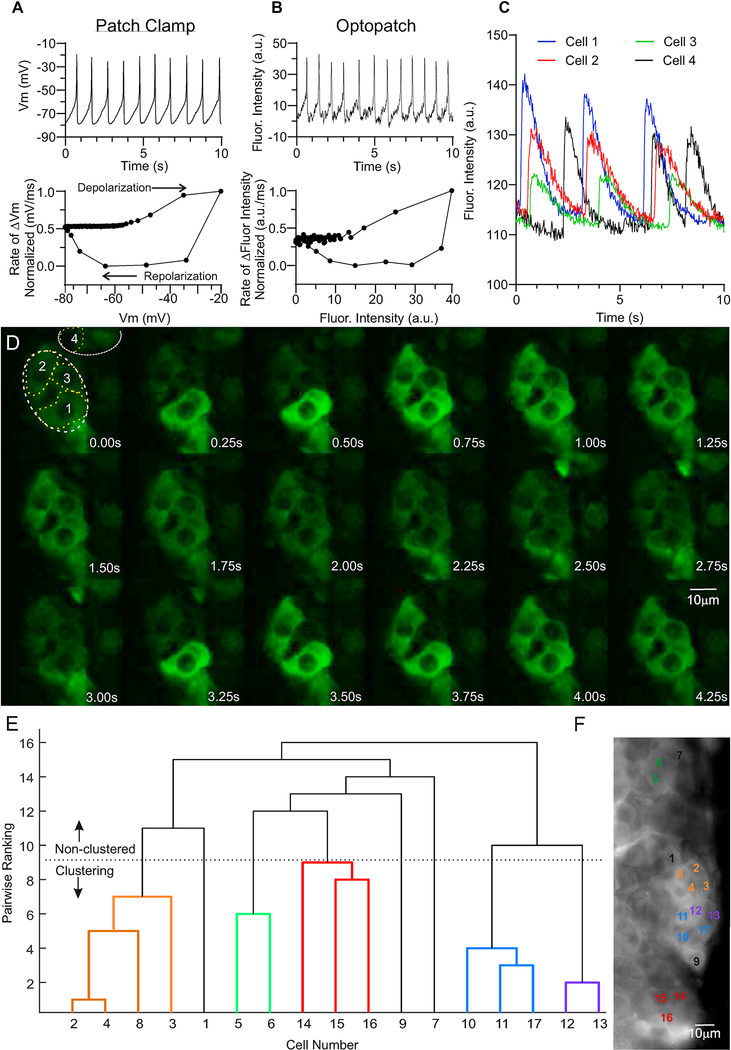
Figure 4. Intrinsic activities of zG cells in rosettes.
A-B. Representative electrophysiological (A) and optical (B) recordings of membrane voltage oscillations evoked by 1μM Ang II from zG cells residing in rosettes. A. Upper: Whole-cell current-clamp recording; data acquisition was collected at 2.5KHz, but subsequently reduced to 100Hz to match the Archaerhodopsin fluorescence acquisition rate using the Decimate data reduction method with Clampfit v10.4 software. Lower: Normalized phase-plane plot of averaged voltage oscillation, showing arc of voltage change. B. Upper: Archaerhodopsin fluorescent trace. Lower: Phase-plane plot of voltage oscillation recorded optically showing similar voltage trajectory, verifying voltage oscillations in zG cells with preserved intracellular milieu. To compare fluorescent intensity (a.u.) and voltage (mV) data, values were scaled between 0 (Xmin) and 1 (Xmin), and calculated as: . C. The time-dependent changes in fluorescent intensity [arbitrary units (a.u.)] within regions of cells 1 (blue), 2 (red), 3 (green), and 4 (black) from A are plotted over 10 seconds, illustrating coordinated activity among zG cells within a rosette (1–3), but often asynchronous activity among cells within different rosettes (e.g., Cells 1–3 vs 4). D. Time lapse (0.25 sec intervals) of Ca2+-evoked fluorescent activity of zG cells in an adrenal slice elicited by 3nM Ang II as reported by genetically encoded GCaMP3. Images were acquired at 40Hz at 63x using a custom spinning disc confocal microscope and Slidebook 6.0.18 software [Intelligent Imaging Innovations, Inc. (3i)]. Output levels were adjusted to optimize clarity but include all information-containing pixels. Images were cropped to highlight a rosette (white dotted lines, cells 1–3), as well as a few extra-rosette cells (cell 4). Scale bar represents 10μm. E. Dendrogram illustrating Ca2+ activity coordination among zG cells expressing GCaMP3 in an adrenal slice elicited by 3nM Ang II, as determined by a functional clustering algorithm. Clearly defined cells given arbitrary number designations (X-axis) were grouped pair-wise by the degree of temporal synchrony among Ca2+ oscillatory events, with lower values indicating a greater degree of synchrony. zG cell clusters paired below the dotted line (color-coded) represent coordinated activity groups that statistically differ from pairwise comparison of 10,000 semi-randomly generated surrogate data sets per cell. Non-clustering cells (black) do not have significant coordinated activity with other cells/clusters analyzed. F. Image of averaged pixel intensity (acquired on Zeiss Examiner. Z1 at 20Hz, Slidebook 6.0.18 software, 1,000 frames averaged using ImageJ software), showing the anatomical location of cells in (E, color-matched). zG cells within a given rosette are more likely to have coordinated Ca2+ activity, whereas those outside of that rosette are rarely assigned to the same functional cluster. Scale bar represents 10μm.

