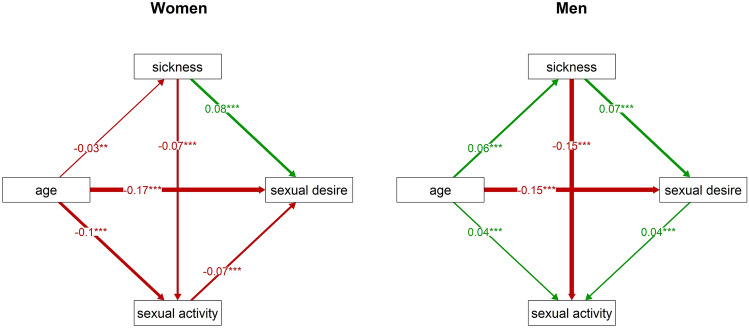
Figure 3.
Direct and indirect effects of the sickness index on sexual desire in women and men. This figure charts the results of path analyses: it shows relations between sexual desire, the sickness index, sexual activity, and age, separately for women (left) and men (right). The numbers at arrows show standardised parameter estimates. It is more parsimonious to expect that in men, sexual desire positively influences sexual activity than that sexual activity positively influences sexual desire. The direction of the arrow between sexual desire and sexual activity was therefore reversed in the men’s model (see “Discussion”). Associations with p values under 0.01 are marked by ‘**’, and those with p values under 0.001 are marked by ‘***’.

