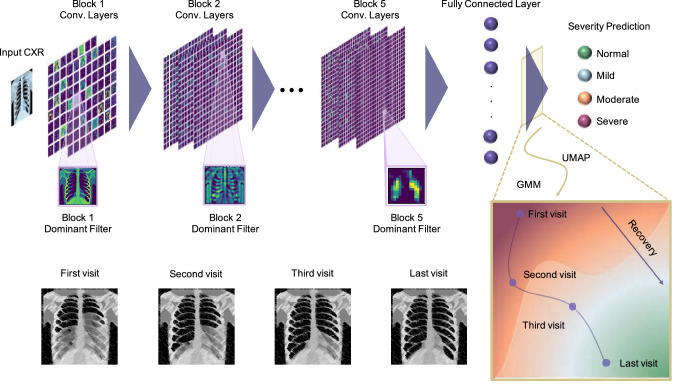
Figure 1.
Workflow of COVID-19 severity assessment and prognosis model. The input CXR is fed into the CNN and will be processed by the network to extract the features and classify the severity degree of the disease. At each layer of the CNN, the outputs of the most dominant channels will be visualized using a pruning approach to understand the decision-making process and extracted features by the CNN. To monitor the progress of the disease, we reduce the dimensionality of the last fully connected layer using UMAP and use the Gaussian Mixture Model (GMM) to cluster the space into different severity regions. For series of input CXRs of a patient, we use the trained CNN to assess the severity degree at each visit and use the latent-space representation to visualize and monitor the progress of the disease in 2D space. Note that the X-ray images (from VectorStock) and figures are conceptual and the results for each part are presented in the following sections.

