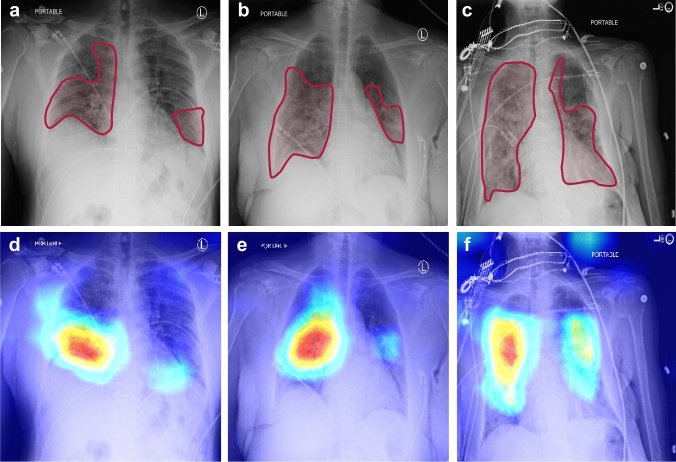
Figure 3.
CXRs and saliency maps for three patients chosen from the unseen test dataset. The CXRs and affected areas for patients with (a) mild, (b) moderate, and (c) severe COVID-19 pneumonia (analyzed by our expert radiologist). (d–f) The corresponding saliency maps for CXRs (found by our AI approach). The true class probability for the images are 0.96, 0.67, 0.89, respectively. The saliency maps and regions of interest match well for all CXRs.

