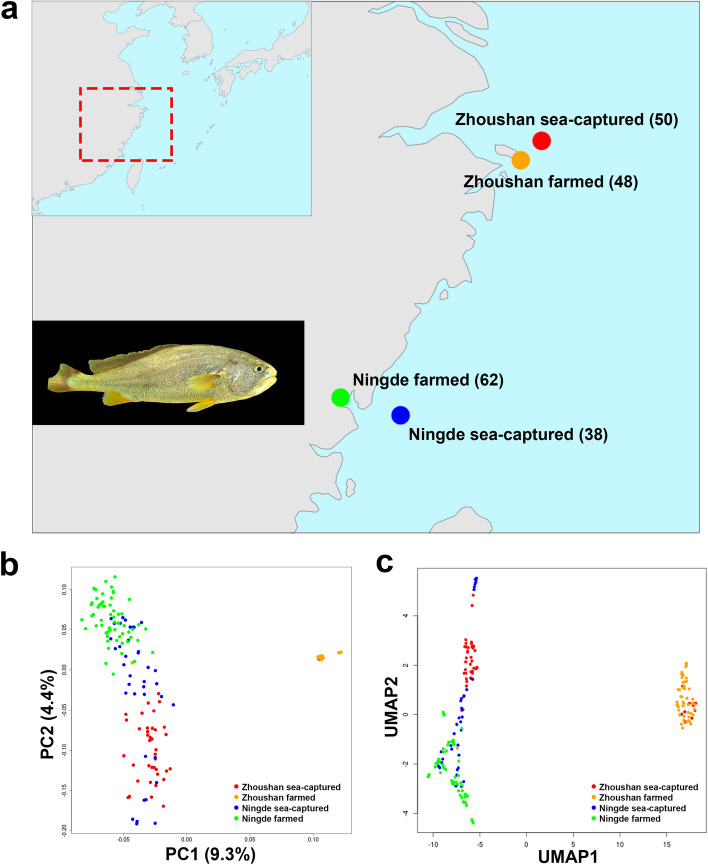
Figure 1.
Population structure and relationship of large yellow croaker. (a) Geographic map indicating the sample origins of the large yellow croaker in this study. The gross appearance of a large yellow croaker individual is shown in the picture. The sampling area is highlighted by the red broken line. The dots of different color stand for different population. The number of individuals is given in parentheses after the population name. The geographical maps were generated by using R packages of maps v3.3.0 (https://cran.r-project.org/web/packages/maps) and mapdata v2.3.0 (https://cran.r-project.org/web/packages/mapdata). (b) PCA plot (PC1 and PC2) showing the genetic structure of the 198 large yellow croaker individuals. The degrees of explained variance is given in parentheses. Colors reflect the geographic regions in (a). (c) UMAP of the 198 large yellow croaker individuals. Colors reflect the geographic regions in (a).

