Figure 2.
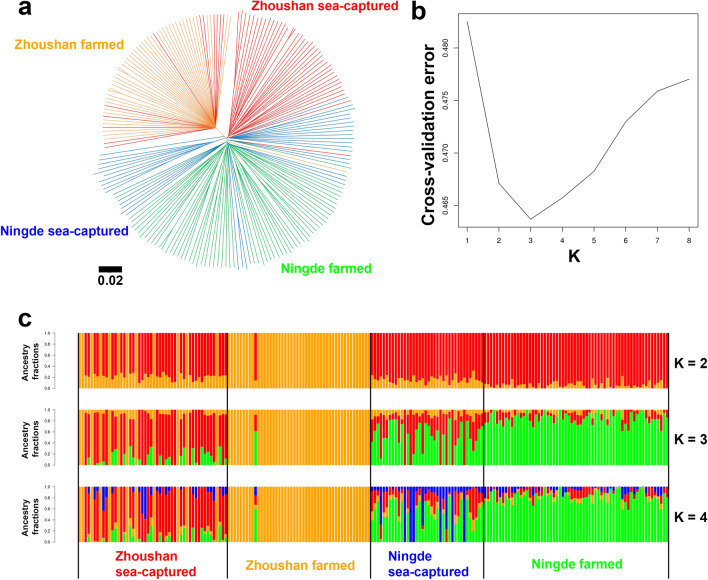
Neighbor-joining tree and admixture analysis using whole-genome SNP data. (a) Neighbor-joining tree of the 198 large yellow croaker individuals. The color scheme follows Fig. 1. The scale bar represents pairwise distances between different individuals. (b) Cross-validation error in the admixture analysis. The x-axis represents K values and the y-axis represents the corresponding cross-validation error. The cross-validation error was lowest at K = 3. (c) Admixture plot (K = 2, 3, 4) for the 198 large yellow croaker individuals. Each individual is shown as vertical bar divided into K colors. The color scheme follows Fig. 1. Individuals are arranged by population.

