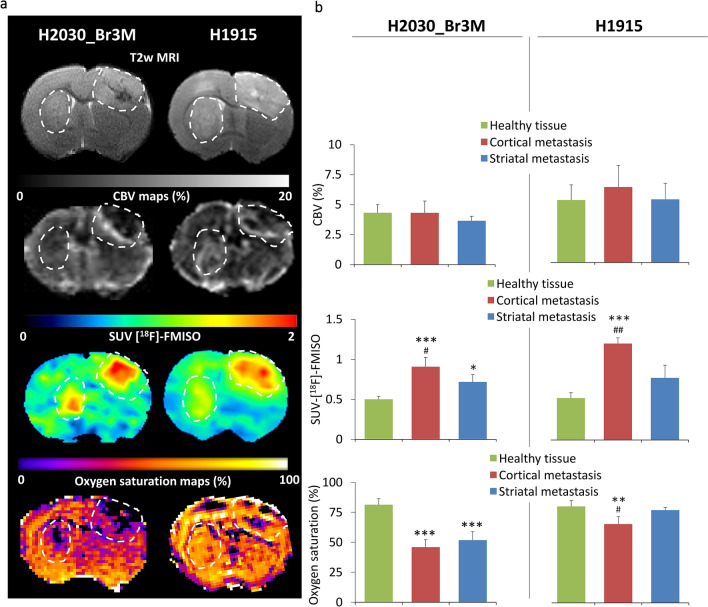
Figure 5.
Multimodal imaging characterization of vascularization and hypoxia. (a) Representative images of H2030-Br3M and H1915 brain metastases (right and left respectively, hatched line). From the top to the bottom: T2w MRI, CBV-MRI map, [18F]-FMISO-PET and Oxygen saturation-MRI map. (b) Quantitative analyzes of multimodal imaging characterization. From top to the bottom: CBV (%), SUV-[18F]-FMISO and Oxygen saturation (%). Mean ± SD, n = 3 for H1915 and n = 4 for H2030-Br3M model, *p < 0.05, **p < 0.01 and ***p < 0.001 versus healthy tissue and #p < 0.05 and ##p < 0.01 versus striatal metastasis.

