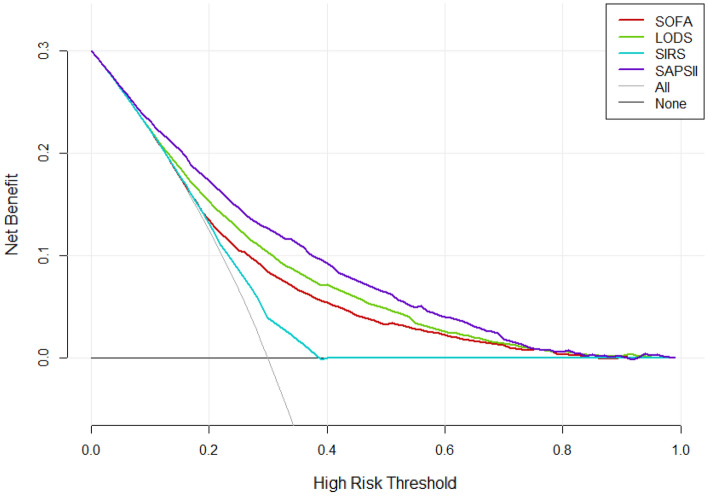
Figure 4.
Decision curve analysis (DCA) of the four scoring systems for all cases in the cohort study. The net benefit curves for the four scoring systems are shown. X-axis indicates the threshold probability for clinical outcome and Y-axis indicates the net benefit. Solid red line = SOFA, solid green line = LODS, solid blue line = SIRS, solid purple line = SAPS II. The preferred scoring system is SAPS II, the net benefit of which was the largest among the four scoring systems.

