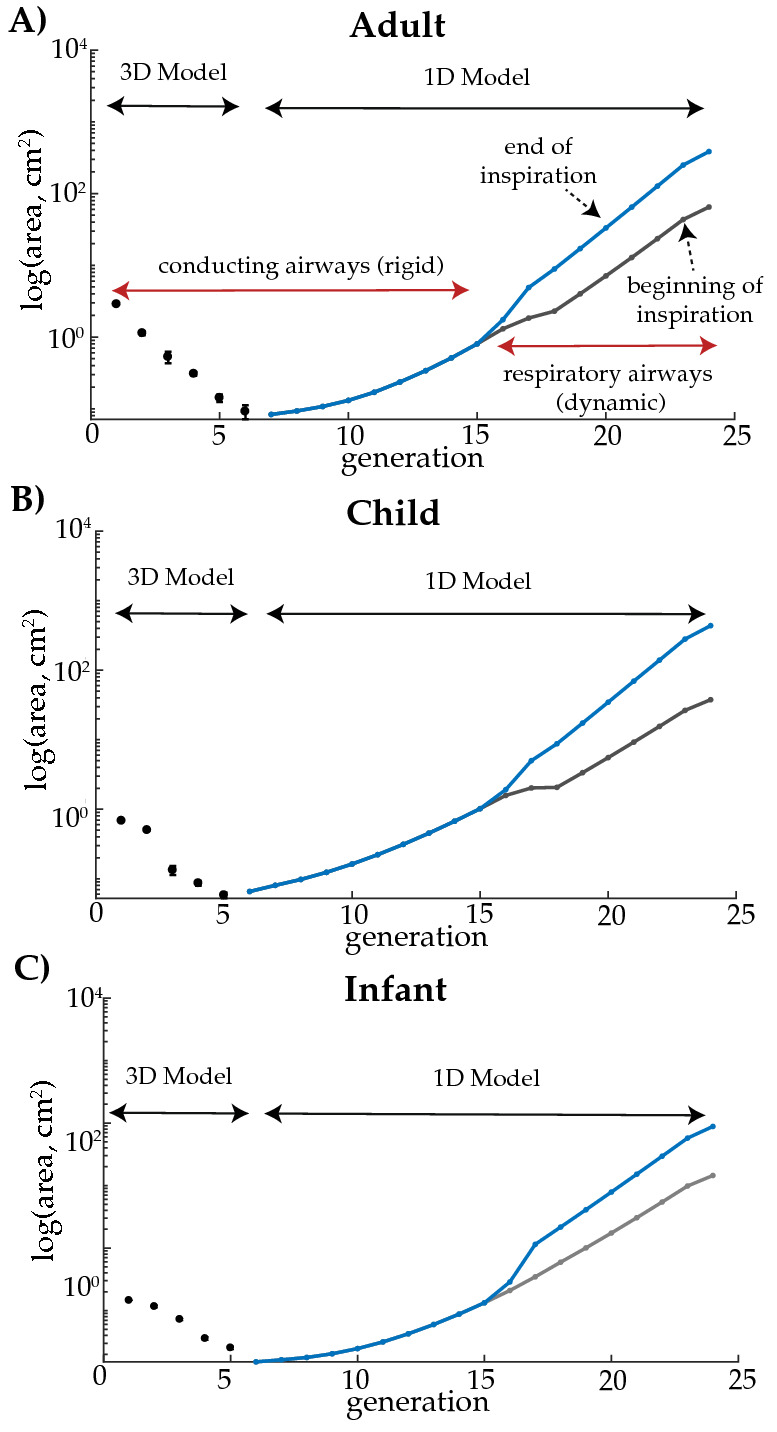
Figure 2.

Cross-sectional areas of representative branches in the lower left lobe of the adult (panel A), child (panel B), and infant (panel C) models. Note, for the outlined 3D regions, the areas are measured directly from the image-based models (error bars represent the standard deviation of the airways within each generation). The 1D regions are idealized and scaled to match FRC (Table 2). The conducting and respiratory zones are highlighted in panel (A), where the blue and gray lines represent the total cross-sectional area at the end and beginning of inspiration, respectively.
