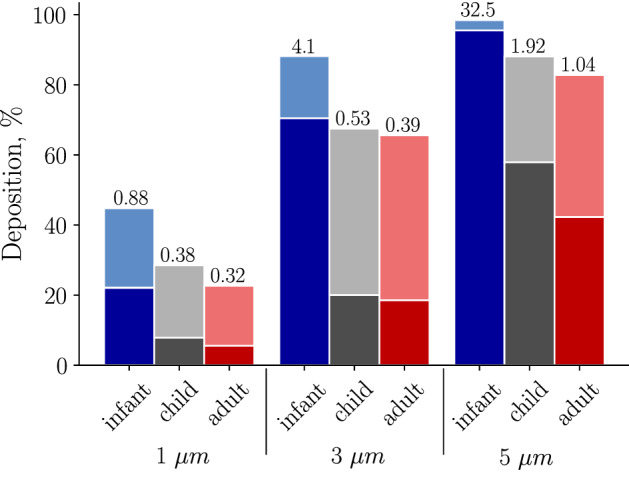
Figure 3.

Whole lung deposition percentages for the three models are shown for each of the particle sizes simulated. Note, the conducting (C) and respiratory (R) zones are shown in dark and light shades, respectively. The ratio of deposited particles between the conducting and respiratory zones, CR ratio, are displayed above each bar. Figure 2 points to the conducting and respiratory zones. Note, the conducting zone includes both the 3D model and part of the 1D model.
