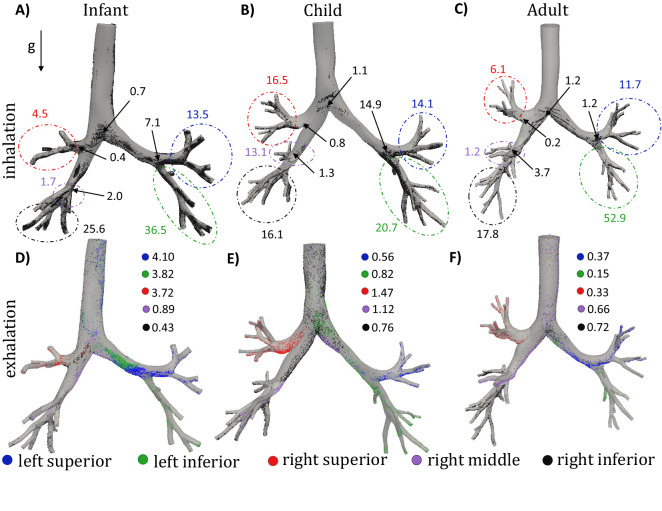
Figure 5.
Deposited particle locations for infant (panels A,D), child (panels B,E), and adult (panels C,F) for the 3 m diameter particles. Panels (A–C) highlight deposited hotspots for inspiration, where the values represent the regional deposition percentage (based on the number of particles depositing during inhalation only). Hotspots for expiration are shown in panels (D–F); the particles are color coded based on the lobe that they originated from. Presented values (panels D–F) are the percent of deposited particles, calculated from the number of particles released back into the 3D model (not total deposition percentages).

