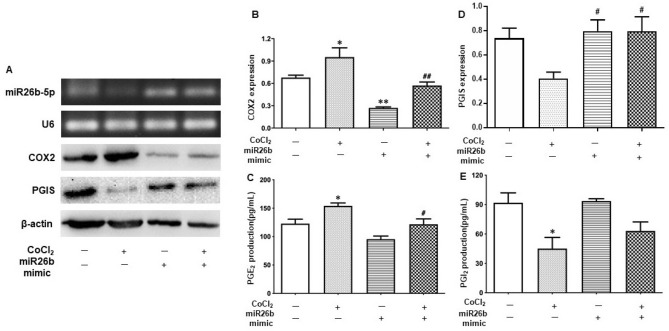
Figure 2.
Overexpression of miR-26b-5p suppresses the increase of COX-2 expression and PGE2 release but prevents the decrease of PGI2 release induced by CoCl2 in placental trophoblasts. (A) Representative blots of COX-2 and miR-26b-5p expression in HTR-8/SVneo cells transfected with miR-26b mimics with or without treatment with CoCl2, showing that CoCl2-induced increase in COX-2 expression could be blocked in cells transfected with miR-26b mimics. (B) The bar graphs show the relative COX-2 expression after normalized with β-actin expression in each sample. *P < 0.05: CoCl2 alone vs control. **P < 0.01: miR-26b mimics vs control. ##P < 0.01: miR-26b mimics + CoCl2 vs CoCl2 alone. Data are expressed as mean ± SE from five independent experiments. (C) Production of PGE2 by HTR-8/SVneo cells in the experiment described in A, showing that increase of PGE2 formation induced by CoCl2 was significantly attenuated in the cells transfected with miR-26b mimics. *P < 0.05: CoCl2 alone vs control. #P < 0.05: miR-26b mimics + CoCl2 vs CoCl2 alone. Data are expressed as mean ± SE from six independent experiments. (D) The bar graphs show the relative expression of PGIS after normalized with β-actin expression in each sample. #P < 0.05: miR-26b mimics or miR-26b mimics + CoCl2 vs CoCl2 alone. Data are expressed as mean ± SE from five independent experiments. (E) Production of PGI2 by HTR-8/SVneo cells in the experiment described in A. PGI2 formation is reduced in the cells cultured with CoCl2, which was partially prevented when the cells transfected with miR-26b mimics. *P < 0.05: CoCl2 alone vs control. Data are expressed as mean ± SE from three independent experiments.

