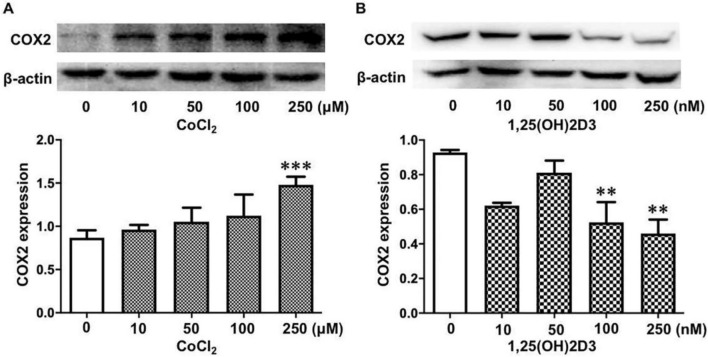
Figure 3.
Dose-effects of vitamin D and CoCl2 on COX-2 expression in placental trophoblasts. (A) Protein expression for COX-2 in HTR-8/SVneo cells treated with different concentrations of CoCl2. The bar graphs show relative protein expression after normalization against β-actin from four independent experiments. CoCl2 induced a dose-dependent increase in COX-2 expression. ***P < 0.001: 250 μM vs control. (B) Protein expression of COX-2 in HTR-8/SVneo cells treated with different concentrations of 1,25(OH)2D3. In contrast to CoCl2, 1,25(OH)2D3 causes a dose-dependent decrease in COX-2 expression in placental trophoblasts. The bar graphs show relative protein expression after normalization to β-actin from three independent experiments. **P < 0.01: treated vs control cells.

