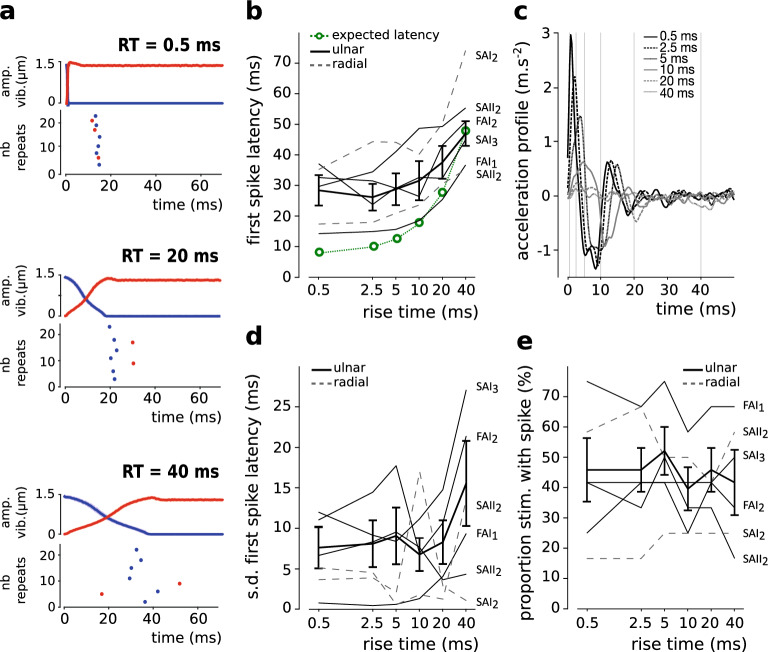
Figure 3.
Rise time manipulation. (a) Profiles of ultrasonic vibration (average and s.d. traces), and the corresponding raster plots are shown for FAI1 for three rise time conditions (0.5, 20 and 40 ms). Colours illustrate the friction condition, i.e. increase in friction over time (which corresponds to a decrease in ultrasonic vibration value, blue) or decrease (red). Dot filling represents the sliding direction, with filled dots for the ulnar direction and unfilled dots for the radial direction. Note that the unit presented FAI1 does not fire in the radial direction. (b) First spike latency as a function of the rise time conditions. Individual traces (ulnar and radial) and group results (ulnar only, N = 4). The error bars represent the standard error of the mean (s.e.m). In green, an estimation of the expected first spike latency. (c) Group acceleration profile. Individual acceleration curves were normalized as a function of the friction condition (increase or decrease) and of the sliding direction. They were then averaged for each participant, and are here presented as an average obtained for the group (N = 6). The grey grid in background shows the expected stimulation time offsets. Acceleration peaks pointing upwards are revealed especially for the short rise time conditions, at approximately the expected moment, and, their amplitude seems to increase the shorter the rise time. Downwards peaks are also seen around 10, 20 and 40 ms. This profile confirms that the programmed events occurred at the expected moments in time. (d) Standard deviation of the first spike latency as a function of the rise time conditions. The error bars represent the s.e.m. (e) Proportion of stimulations with spike as a function of the rise time conditions. The error bars represent the s.e.m.

